Fig. A.1.
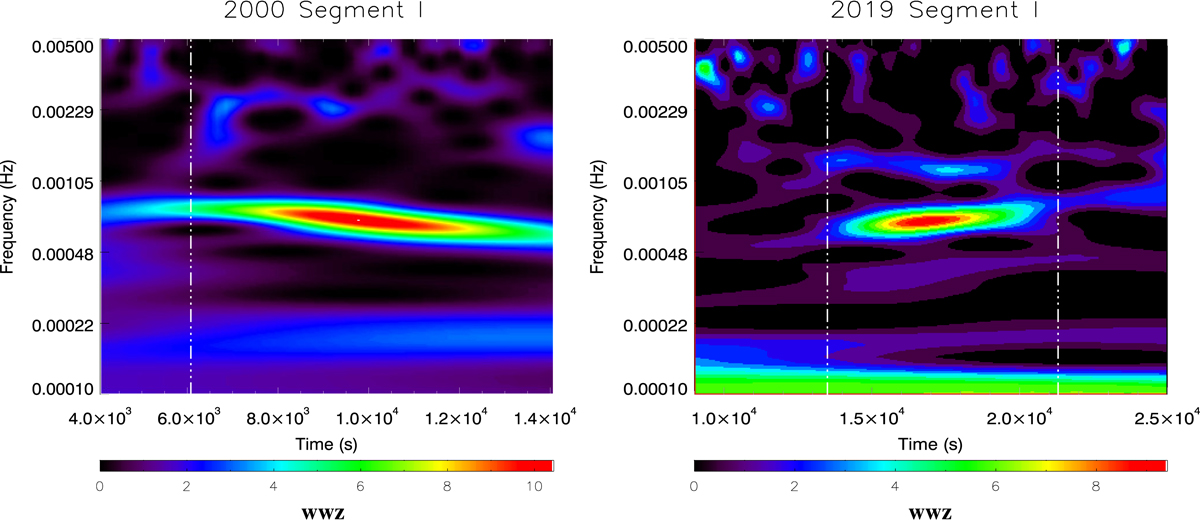
Contour plot of the WWZ power for the Segment I of light curve in the quiescent state (see the left panel of Fig. 1 in the main text). The WWZ power is plotted in the time-frequency (period) plane (XMM2000 observation on the left and XMM2019 observation on the right). The color scale of the WWZ power is shown in the lower panel. The significant regions are within a frequency range of ∼6 × 10⁻⁴ − 8 × 10⁻⁴ Hz for both observations. It can be seen that the QPO signal does not appear for the whole light curve, which is relatively strong in the time segment of 6000−14 100 s for the XMM2000 data, and of 13 500−21 300 s for the XMM2019 data, respectively. The time segments between the vertical dash-dotted lines are selected for the power spectra analysis in the main text.
Current usage metrics show cumulative count of Article Views (full-text article views including HTML views, PDF and ePub downloads, according to the available data) and Abstracts Views on Vision4Press platform.
Data correspond to usage on the plateform after 2015. The current usage metrics is available 48-96 hours after online publication and is updated daily on week days.
Initial download of the metrics may take a while.