Fig. 2.
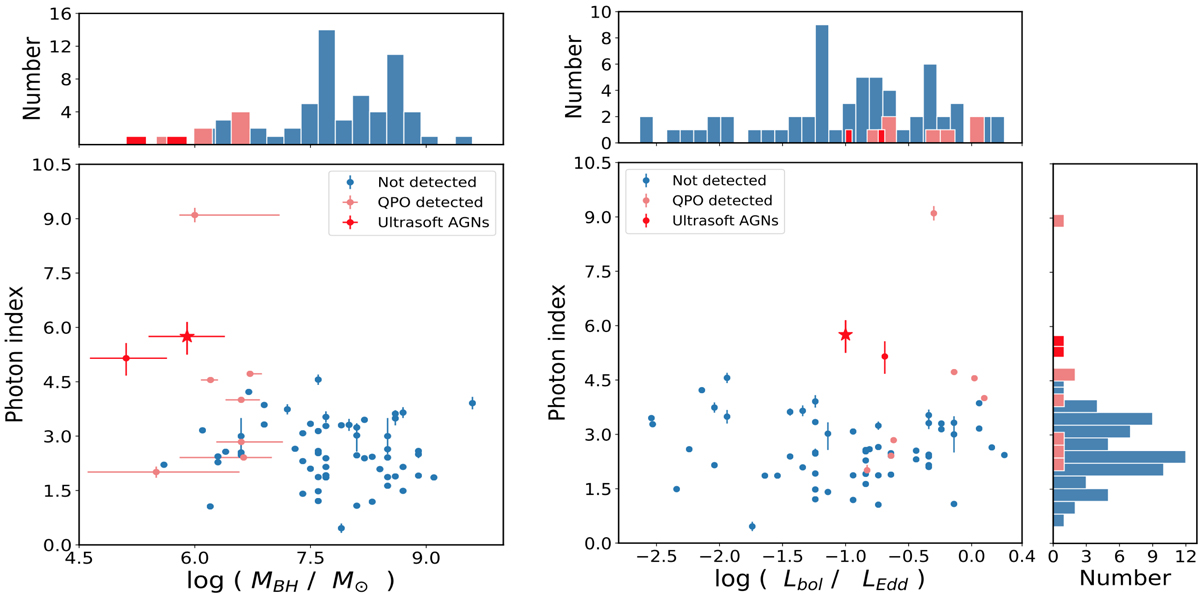
Left: BH mass versus photon index for the SMBH accreting systems in which QPOs are detected, with ultrasoft AGNs highlighted in red. The red star represents J1302. The photon index was derived from the spectral fitting with a simple absorbed power-law model to the soft X-ray spectrum below 2 keV. For a comparison, we overplot the AGN sample of González-Martín & Vaughan (2012) in which QPOs were searched uniformly (light blue), but not found (except for RE J1034+36). Errors on the photon index are given by spectral fittings, corresponding to 90% confidence level for one parameter of interest (Δχ2 = 2.706). The BH masses from the AGN sample of González-Martín & Vaughan (2012) have characteristic errors of ∼0.5 dex (Vestergaard & Peterson 2006). Right: same as left, but for the plot of Eddington ratio versus photon index. Errors on the Eddington ratios are not shown due to the large uncertainties inherent in determining bolometric luminosity and BH mass. Distributions of the BH mass and Eddington ratio and are shown on the top panel, while the distribution of the photon index is shown on the right panel.
Current usage metrics show cumulative count of Article Views (full-text article views including HTML views, PDF and ePub downloads, according to the available data) and Abstracts Views on Vision4Press platform.
Data correspond to usage on the plateform after 2015. The current usage metrics is available 48-96 hours after online publication and is updated daily on week days.
Initial download of the metrics may take a while.