Fig. 1.
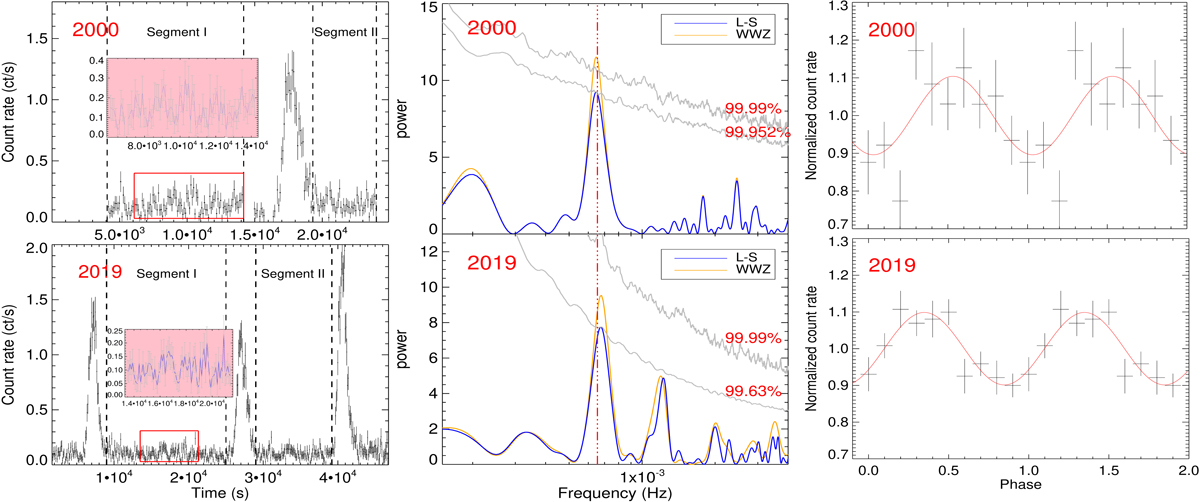
Left: X-ray light curves of J1302 in the energy range of 0.2−2.0 keV. The upper panel is for the XMM2000 observation, while the lower is for the XMM2019 observation, respectively. The inset panel indicates the segment used for the light curve analysis in this Letter. Middle: Lomb-Scargle power as a function of frequency is shown in blue, while the time-averaged WWZ power is shown in orange. Strong peaks are seen at a frequency of ∼6.7 × 10⁻⁴ Hz (∼1500 s) which is indicated with the vertical dash-dotted line. The grey solid lines are single-trial significance curves obtained from the light curve simulations, calculated at each individual frequency bin (local significance, see text for the details). Right: folded X-ray light curve with a period of 1500 s (two cycles are shown). The best-fit sinusoid is shown in red solid line.
Current usage metrics show cumulative count of Article Views (full-text article views including HTML views, PDF and ePub downloads, according to the available data) and Abstracts Views on Vision4Press platform.
Data correspond to usage on the plateform after 2015. The current usage metrics is available 48-96 hours after online publication and is updated daily on week days.
Initial download of the metrics may take a while.