Fig. 7.
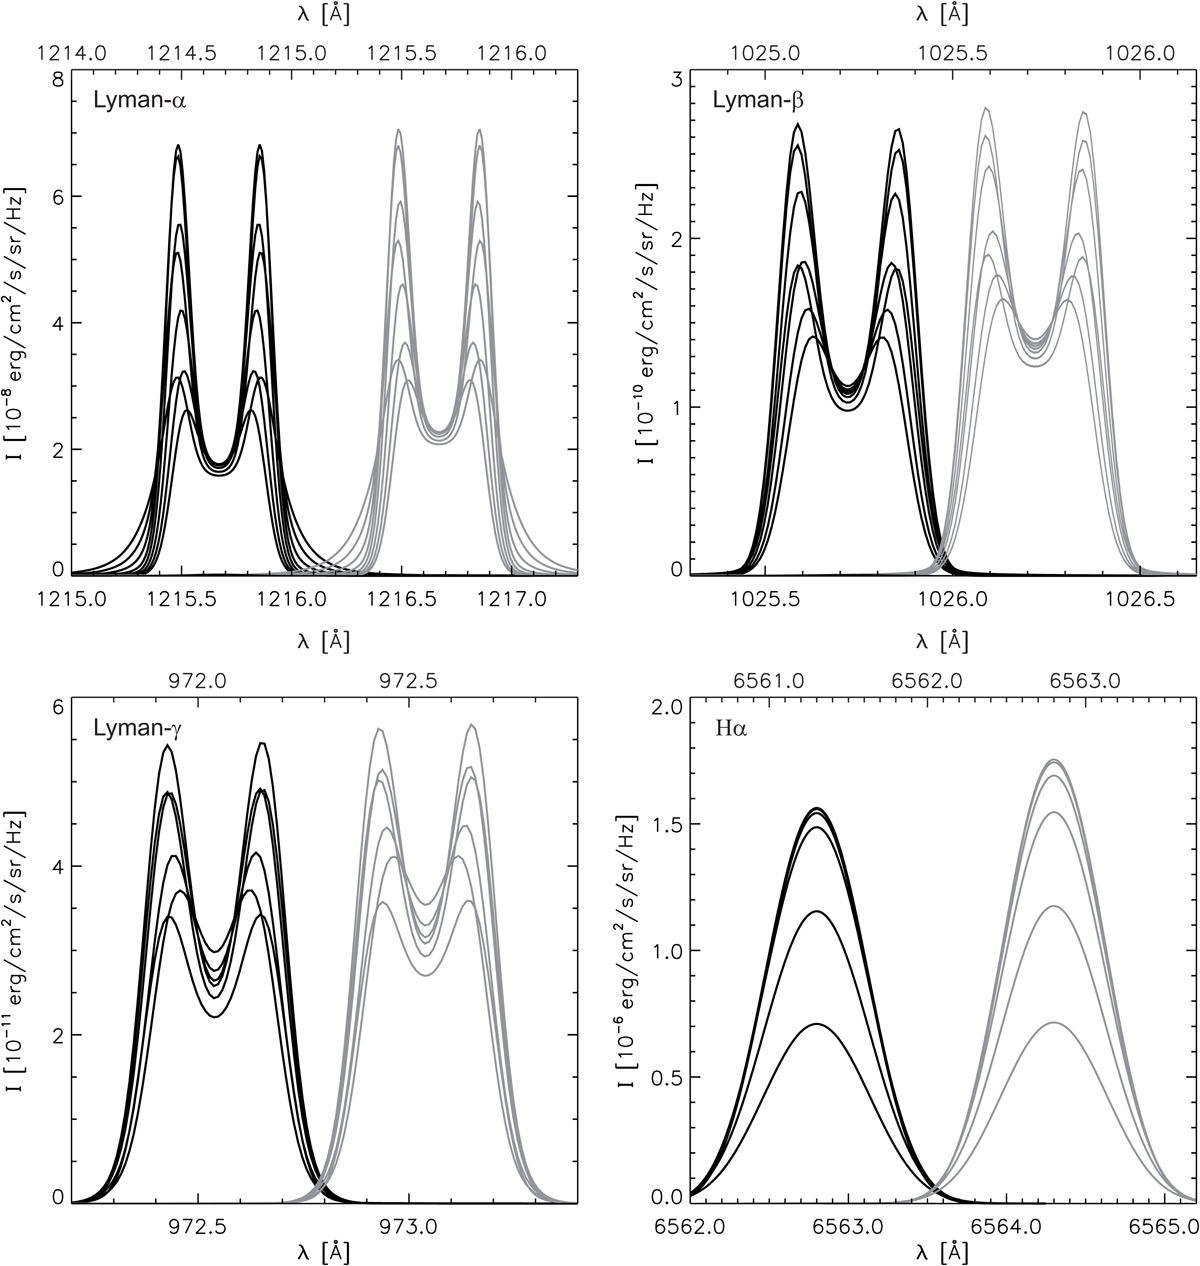
Comparison of synthetic spectra produced by MODEL1 in the single-thread configuration with the illumination data for the reference date June 25, 2008 (black lines) and the date with the maximum illumination change June 24, 2014 (grey lines). We plot only the reversed profiles obtained at different positions along the length of the used 2D prominence fine structure model. We note that the bottom x-axis in each panel corresponds to the black profiles and the top x-axis to the grey profiles. All plotted profiles are convolved with the instrumental profiles of SOHO/SUMER (Lyman lines) or Meudon/MSDP (Hα).
Current usage metrics show cumulative count of Article Views (full-text article views including HTML views, PDF and ePub downloads, according to the available data) and Abstracts Views on Vision4Press platform.
Data correspond to usage on the plateform after 2015. The current usage metrics is available 48-96 hours after online publication and is updated daily on week days.
Initial download of the metrics may take a while.