Fig. 6.
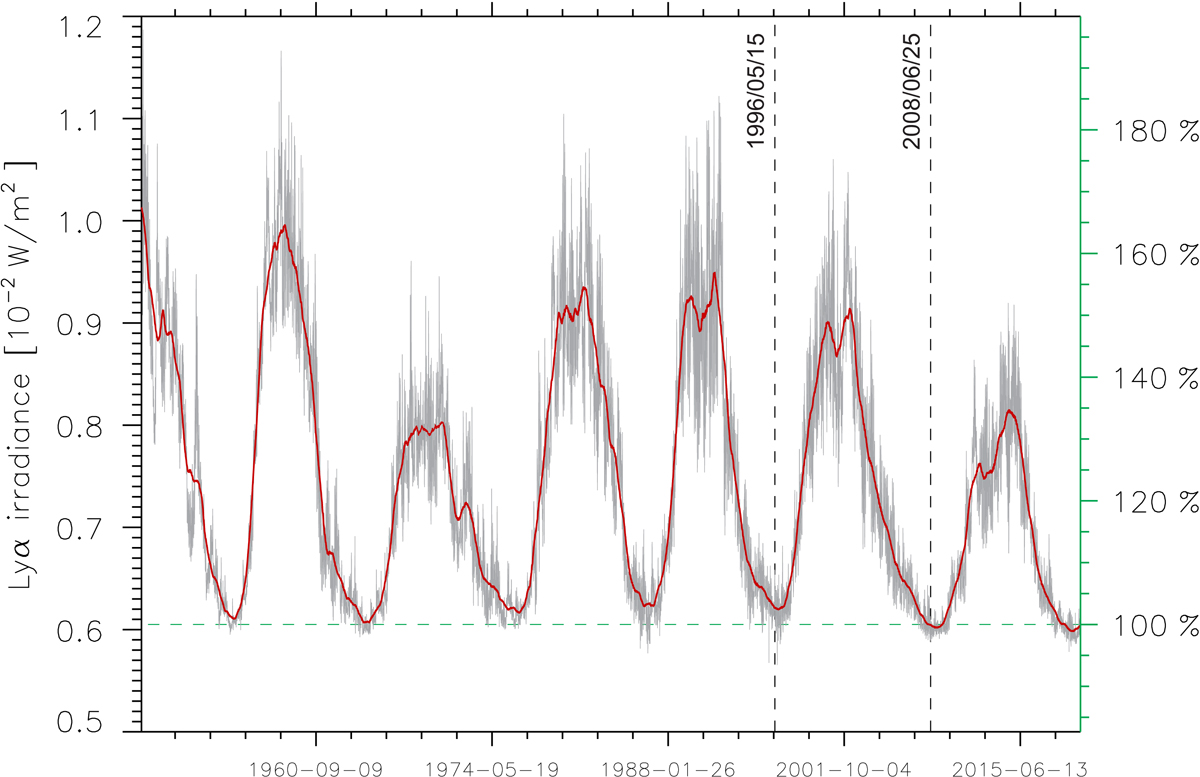
Variation of the total Lyman-α irradiance based on the LISIRD composite Lyman-α index (grey line). The red line shows the same index smoothed by a running average over 400 days. Dashed vertical lines mark the reference date for the observations used in the current work (June 25, 2008) and the date (May 15, 1996) of the observations used in Warren et al. (1998). The y-axis on the right-hand side gives the values of the index as a percentage of the value on the reference day (0.605 × 10⁻² W m−2), marked by the horizontal dashed line.
Current usage metrics show cumulative count of Article Views (full-text article views including HTML views, PDF and ePub downloads, according to the available data) and Abstracts Views on Vision4Press platform.
Data correspond to usage on the plateform after 2015. The current usage metrics is available 48-96 hours after online publication and is updated daily on week days.
Initial download of the metrics may take a while.