Fig. 4.
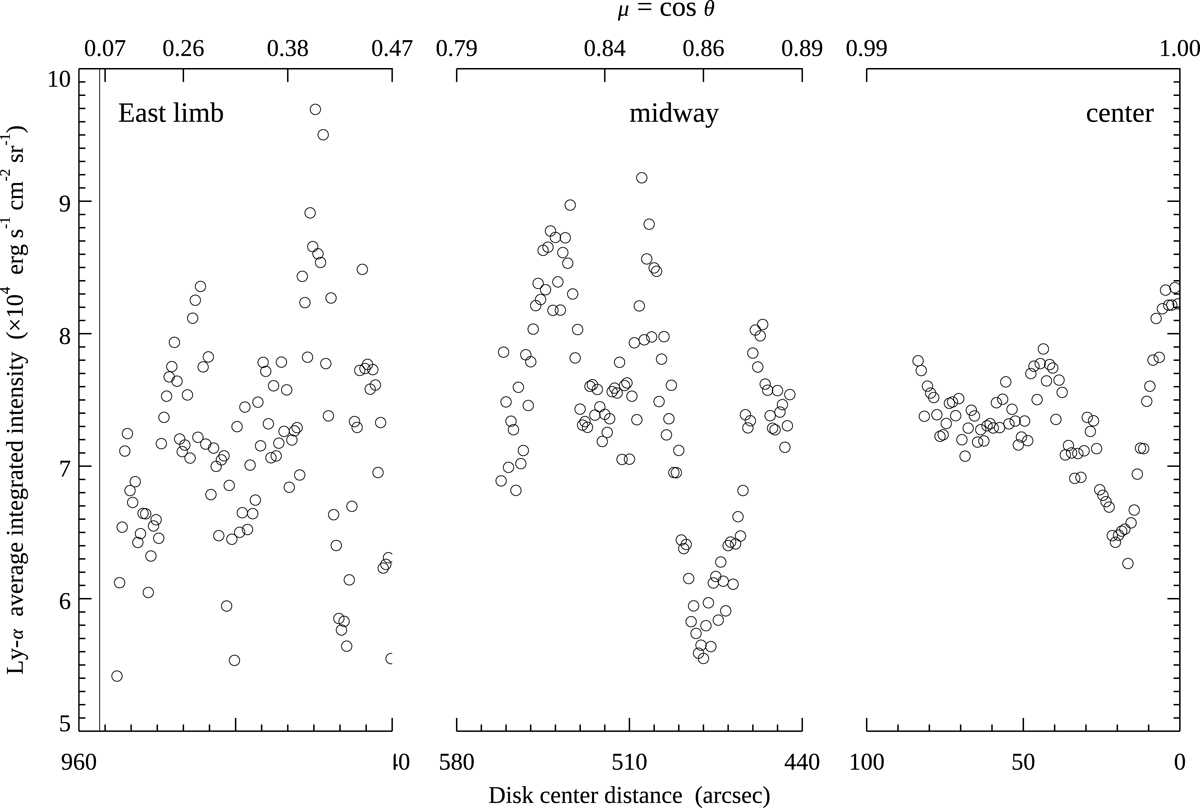
Centre-to-limb variation of the Lyman-α wavelength-integrated intensities averaged over concentric arcs with a width of 1 arcsec. Each plotted circle in sections centre and midway represents an average from rasters obtained on June 24−26, 2008. For the near-limb section, only rasters from June 24 and 25 were used. The thin vertical line shows the solar radius of 952 arcsec as seen from SOHO.
Current usage metrics show cumulative count of Article Views (full-text article views including HTML views, PDF and ePub downloads, according to the available data) and Abstracts Views on Vision4Press platform.
Data correspond to usage on the plateform after 2015. The current usage metrics is available 48-96 hours after online publication and is updated daily on week days.
Initial download of the metrics may take a while.