Fig. 3.
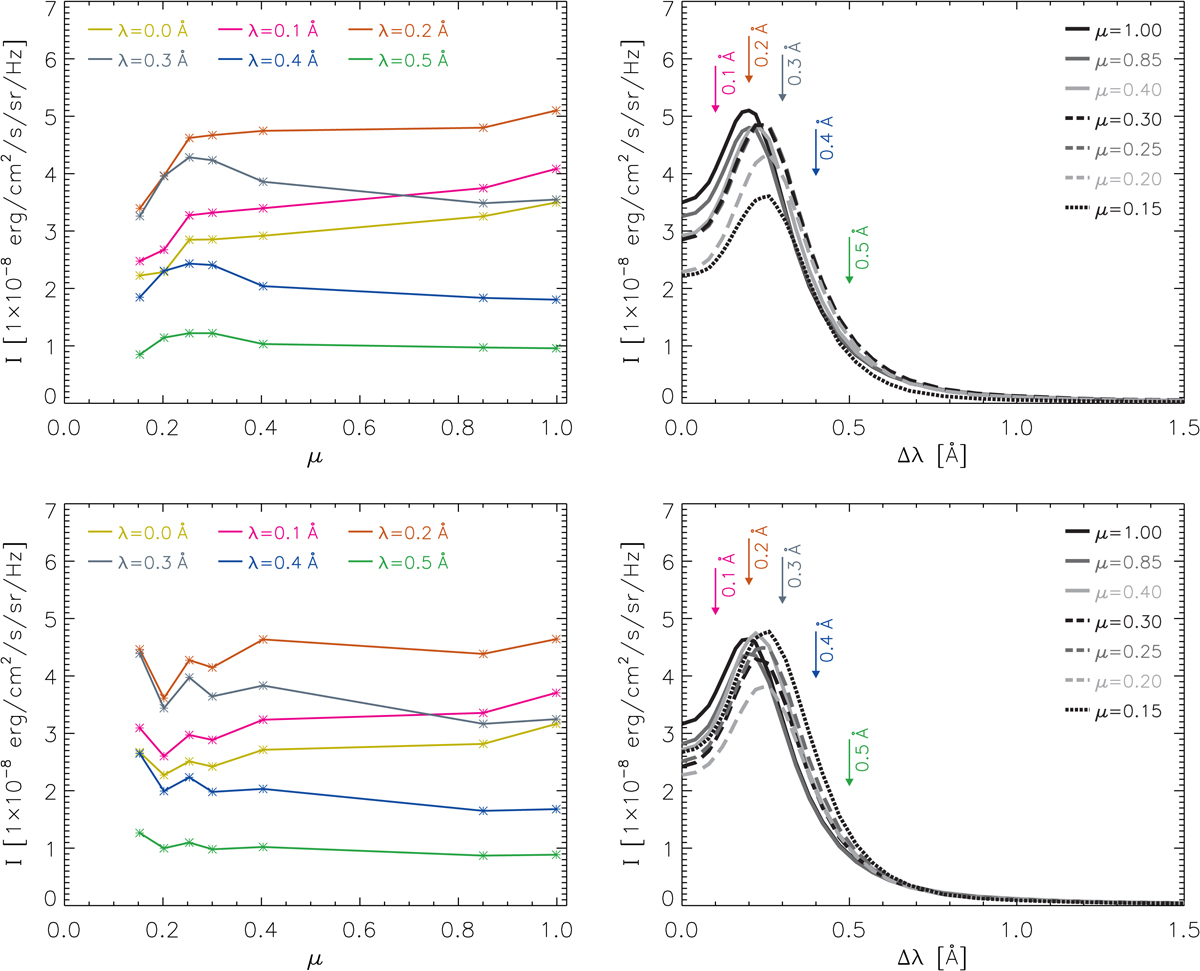
Left column: spatially averaged Lyman-α intensities for selected wavelengths (marked in the upper left corner) as a function of μ. Right column: spatially averaged Lyman-α symmetrized profiles obtained from regions corresponding to Fig. 2. Top row: data obtained on June 24, 2008 and bottom row: data obtained on June 25, 2008.
Current usage metrics show cumulative count of Article Views (full-text article views including HTML views, PDF and ePub downloads, according to the available data) and Abstracts Views on Vision4Press platform.
Data correspond to usage on the plateform after 2015. The current usage metrics is available 48-96 hours after online publication and is updated daily on week days.
Initial download of the metrics may take a while.