Fig. 2.
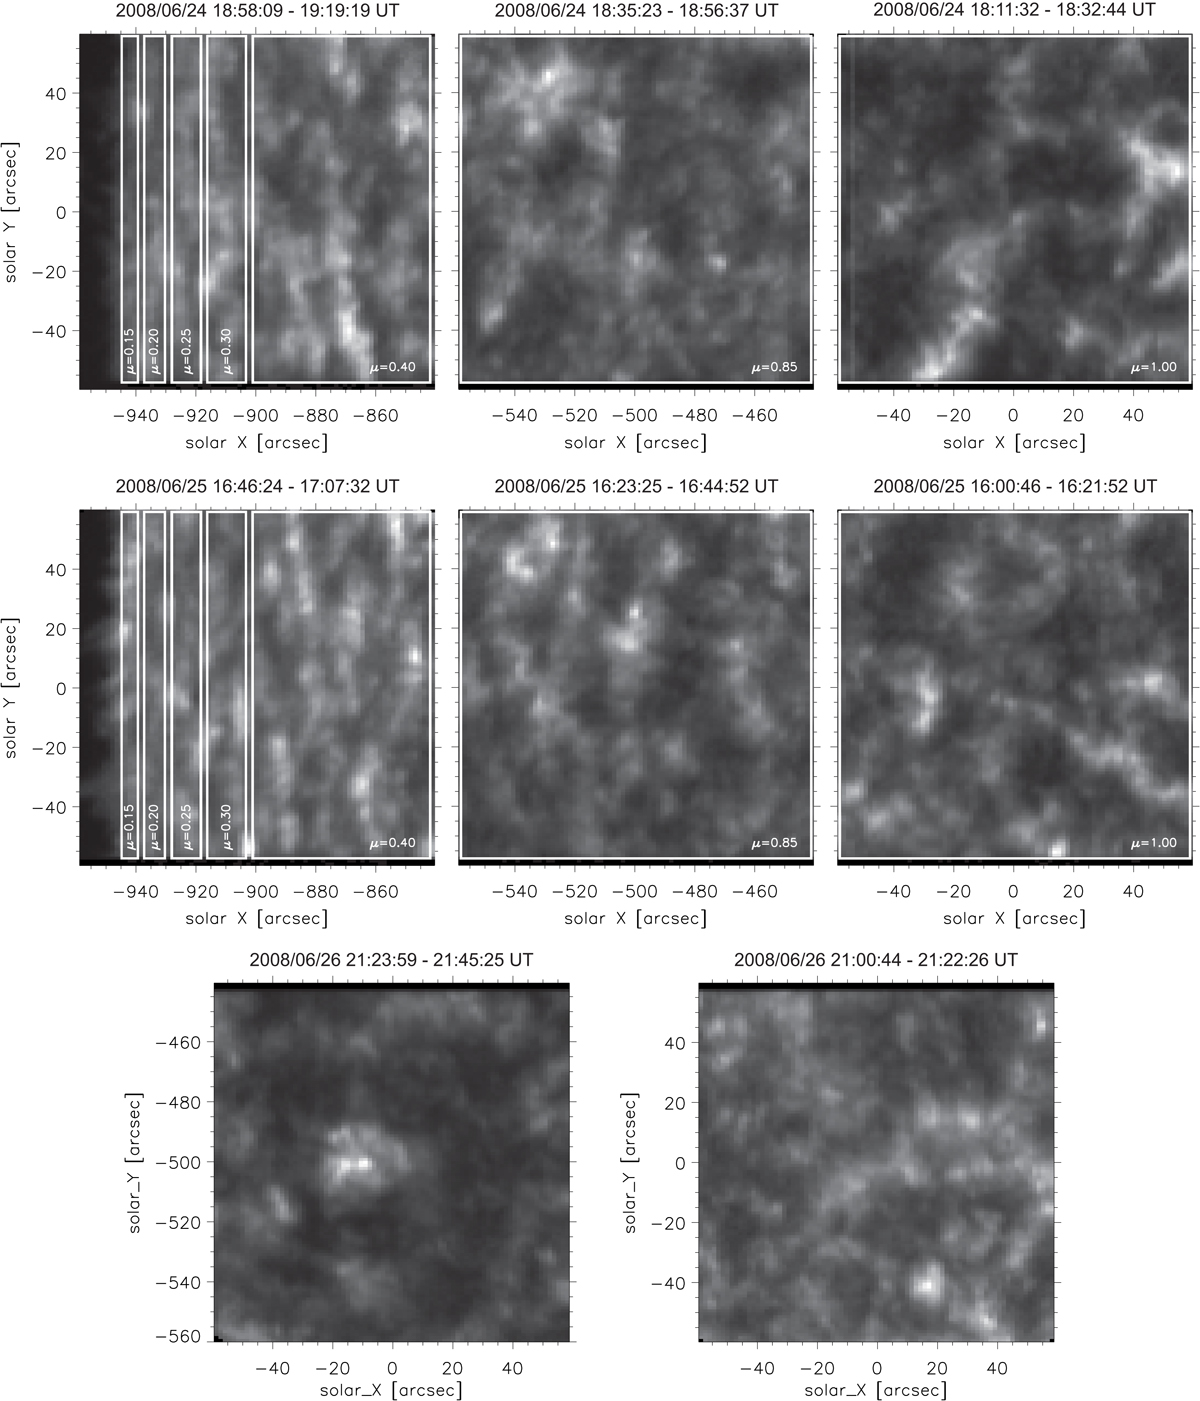
Lyman-α integrated intensity maps in SOHO/SUMER rasters obtained on June 24, 2008 (top row), June 25, 2008 (middle row), and June 26, 2008 (bottom row). White rectangles in rasters in the upper and middle rows highlight the regions selected for spatial averaging. These regions correspond to Fig. 3. Each region is centred at the marked μ value.
Current usage metrics show cumulative count of Article Views (full-text article views including HTML views, PDF and ePub downloads, according to the available data) and Abstracts Views on Vision4Press platform.
Data correspond to usage on the plateform after 2015. The current usage metrics is available 48-96 hours after online publication and is updated daily on week days.
Initial download of the metrics may take a while.