Fig. 5
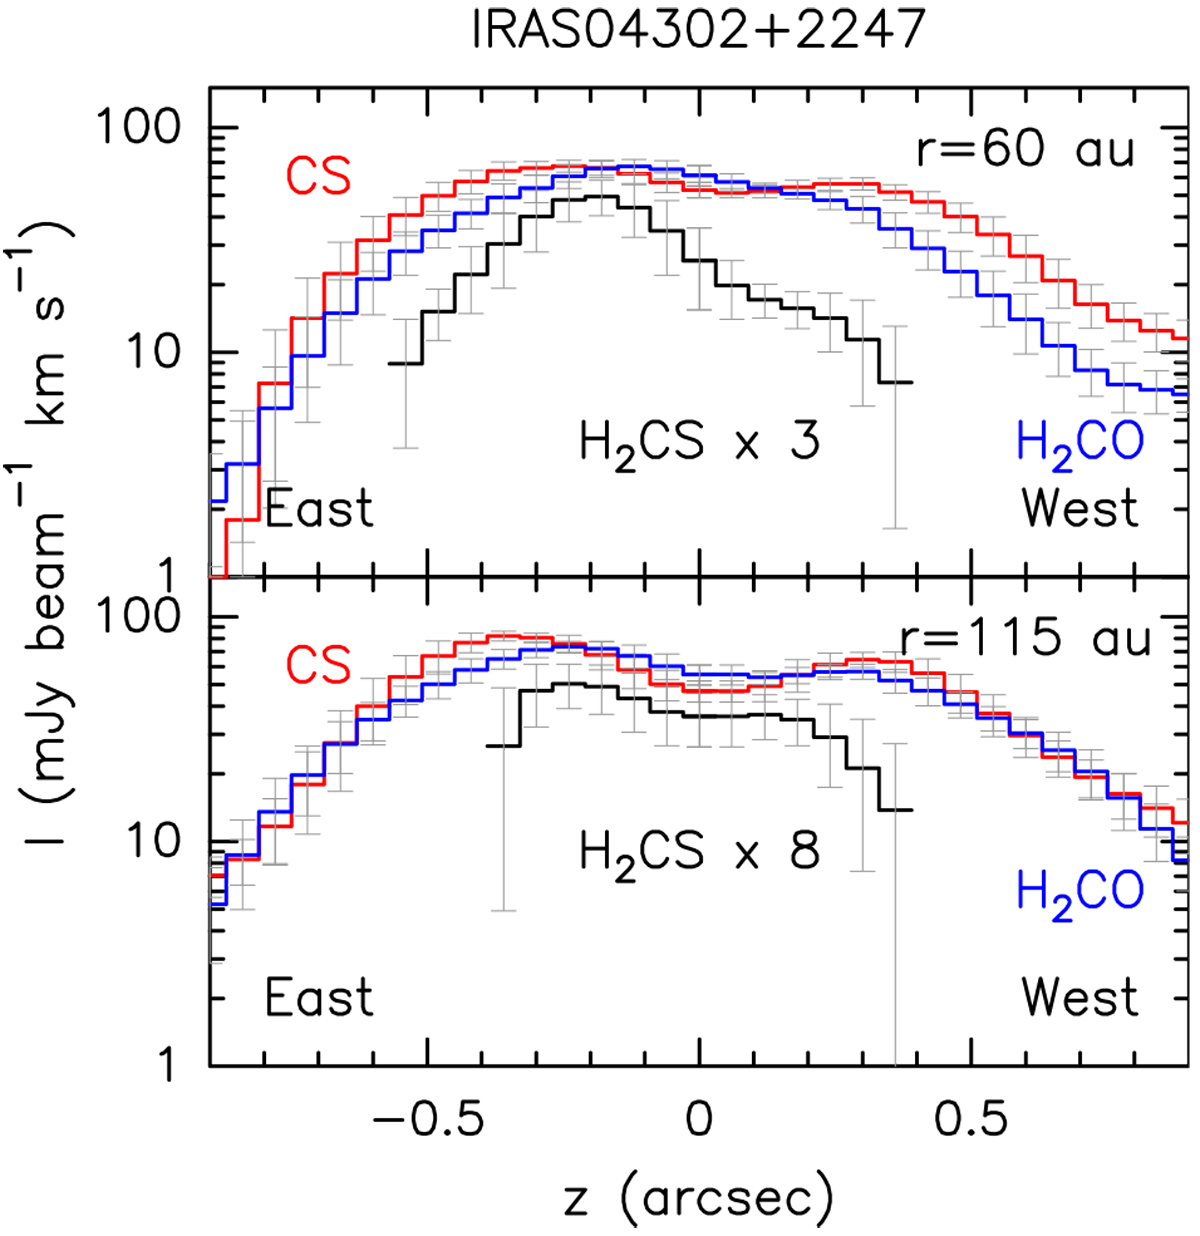
Vertical intensity profile z of H2 CS (black) compared with those of CS(5–4) (red) and o-H2CO(31,2−21,1) (blue), from Podio et al. (2020a). Only fluxes above 3σ confidence are shown. The H2CS intensity has been scaled in order to better compare its profile with those of o-H2 CO and CS. The inner 1′′.8 region is shown, with the positive (negative) values sampling the eastern (western) side. The angular resolution is 0′′. 25 (40 au). The profiles are obtained at ~60 au (upper panel) and 115 au (lower panel) from the protostar.
Current usage metrics show cumulative count of Article Views (full-text article views including HTML views, PDF and ePub downloads, according to the available data) and Abstracts Views on Vision4Press platform.
Data correspond to usage on the plateform after 2015. The current usage metrics is available 48-96 hours after online publication and is updated daily on week days.
Initial download of the metrics may take a while.