Fig. 3
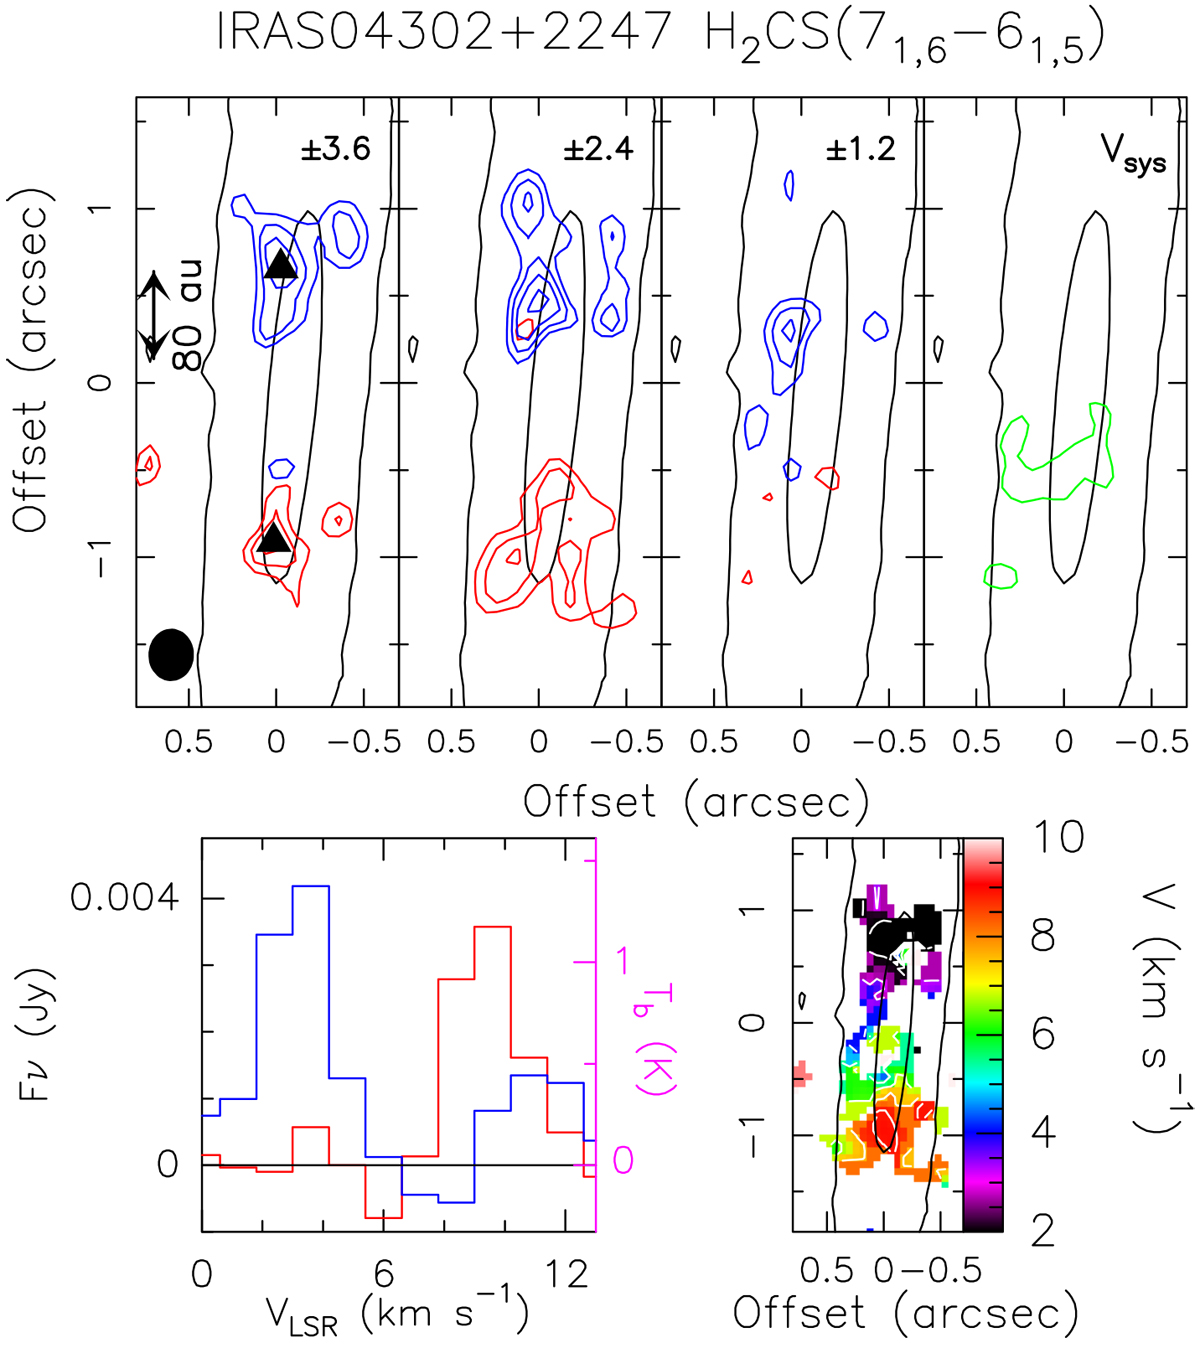
Upper panel: channel maps of the o-H2CS(71,6–61,5) blue- and redshifted emission in the IRAS 04302+2247 disc. Each panel shows the emission integrated over a velocity interval of 1.2 km s−1 shifted with respect to the systemic velocity (~+5.6 km s−1 Podio et al. 2020a, green) by the value given in the upper-right corner. We report the 3σ contour of the continuum emission in black (Fig. 1). The black triangles indicate where spectra have been extracted. The ellipse shows the synthesised beam (HPBW): 0′′. 30 × 0′′.26 (PA = 2°). First contours and steps correspond to 3σ (2.1 mJy beam−1) and 1σ, respectively. Offsets are derived with respect to the continuum peak. Bottom left panel: o-H2 CS(71,6–61,5) spectra in flux and brightness temperature scales (Tb/Fν = 328.593) extracted in the positions marked with a red or blue triangle in the upper panels. Bottom right panel: first-moment map in colour scale.
Current usage metrics show cumulative count of Article Views (full-text article views including HTML views, PDF and ePub downloads, according to the available data) and Abstracts Views on Vision4Press platform.
Data correspond to usage on the plateform after 2015. The current usage metrics is available 48-96 hours after online publication and is updated daily on week days.
Initial download of the metrics may take a while.