Fig. 1
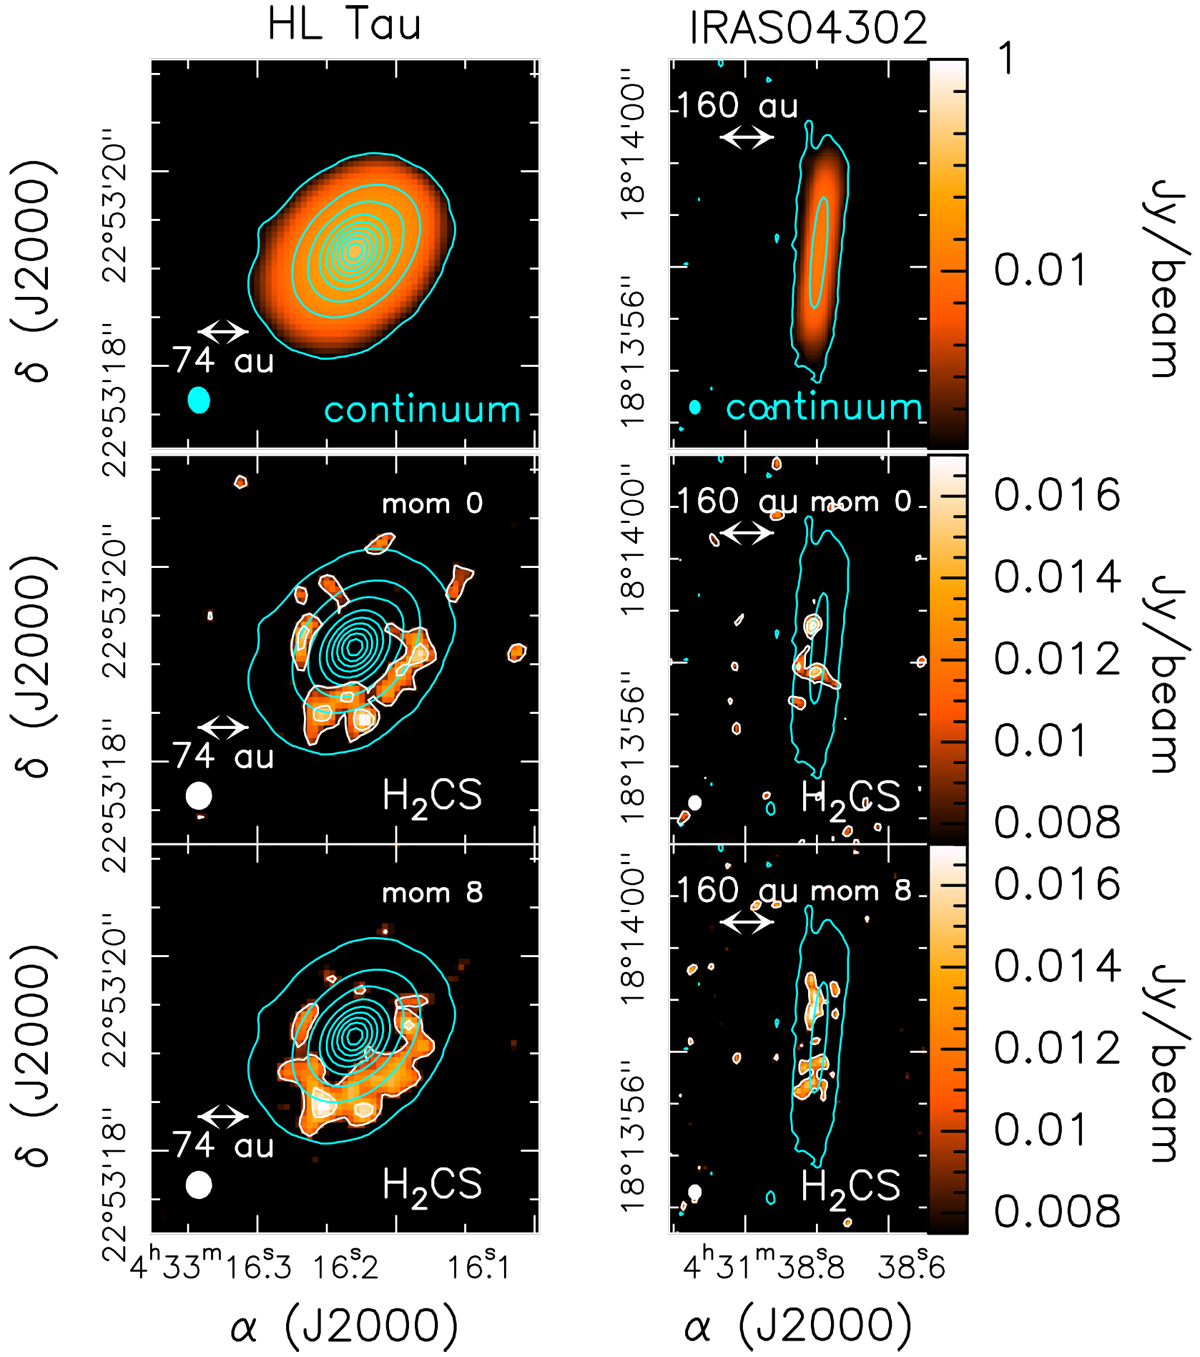
Upper panels: map (cyan contours and colour scale) of the 1.3 mm dust continuum distribution for HL Tau (left) and IRAS 04302+2247 (right) discs. First contours and steps are 3σ (200 μJy beam−1, HL Tau; 115 μJy beam−1, IRAS 04302+2247), and 200σ, respectively. The ellipse in the bottom-left corner shows the ALMA synthesised beam (HPBW): 0′′. 28 × 0′′.25 (PA = –7°), for HL Tau, and 0′′.28 × 0′′.22 (PA = –3°), for IRAS 04302+2247. Middle panels: spatial distribution (moment 0) maps (white contours and colour scale) of the o-H2 CS(71,6–61,5) line based onthe velocity integrated emission (3–11 km s−1, HL Tau, 2–10 km s−1, IRAS 04302+2247) overlaid on the continuum maps (cyan contours). First contours and steps are 5σ (7.5 mJy beam−1 km s−1, HL Tau, and12.5 mJy beam−1 km s−1, IRAS 04302), and 3σ, respectively. The ellipse shows the synthesised beam (HPBW): 0′′.29 × 0′′.27 (PA = 2°) for HL Tau and 0′′.30 × 0′′.26 (PA = 2°) for IRAS 04302+2247. Lower panels: moment 8 maps (white contours and colour scale) of the H2 CS(71,6–61,5) based on the same velocity integrated emission used for the moment 0 maps, overlaid on the continuum maps (cyan contours). First contours and steps are 5σ (3 mJy beam−1 km s−1), and 3σ, respectively.
Current usage metrics show cumulative count of Article Views (full-text article views including HTML views, PDF and ePub downloads, according to the available data) and Abstracts Views on Vision4Press platform.
Data correspond to usage on the plateform after 2015. The current usage metrics is available 48-96 hours after online publication and is updated daily on week days.
Initial download of the metrics may take a while.