Fig. B.2.
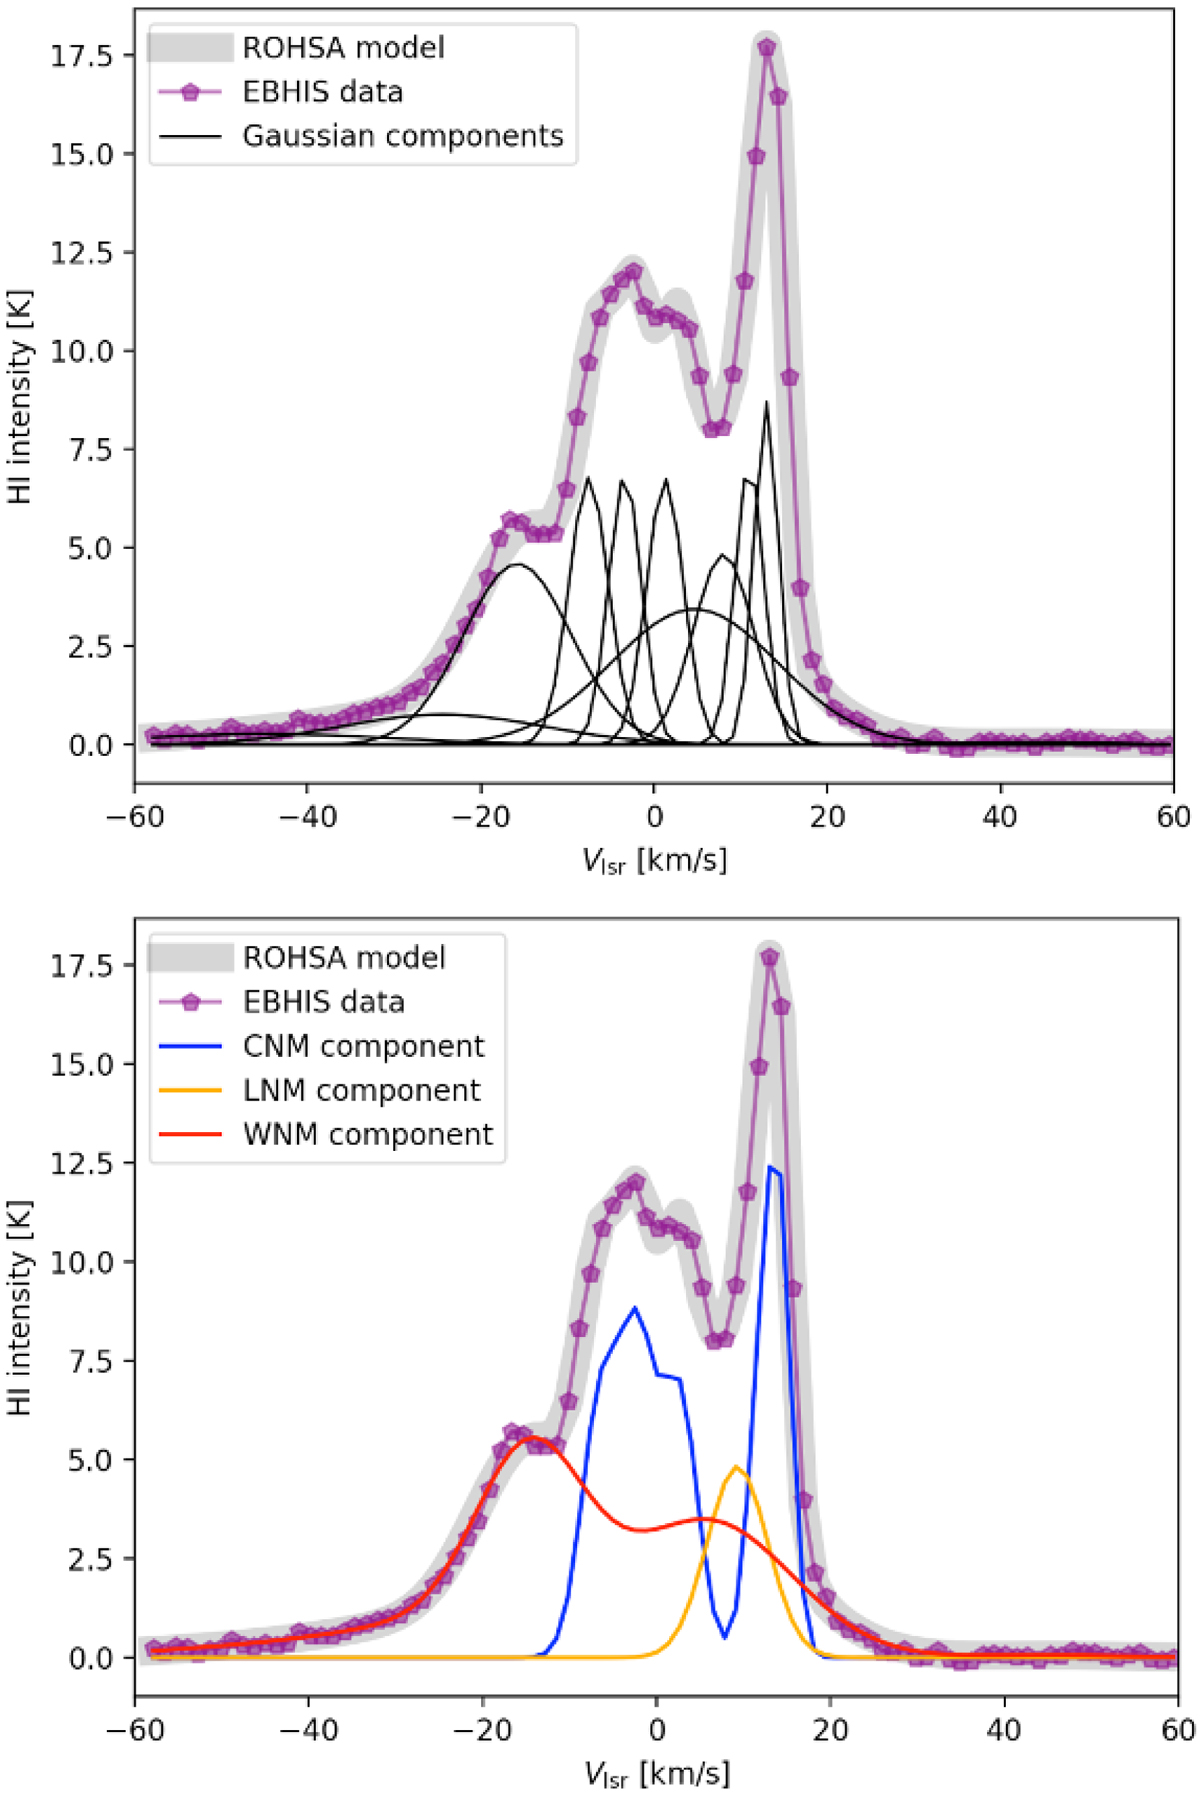
Example of a ROHSA decomposition of the HI spectrum of EBHIS toward the central coordinates of Field A. Top panel: EBHIS HI spectrum shown in purple, Gaussian components in black, and the reconstructed modeled spectrum from ROHSA in gray. Bottom panel: same line of sight as shown in the top panel, with the addition of cumulative contributions of CNM (blue), LNM (yellow), and WNM (red).
Current usage metrics show cumulative count of Article Views (full-text article views including HTML views, PDF and ePub downloads, according to the available data) and Abstracts Views on Vision4Press platform.
Data correspond to usage on the plateform after 2015. The current usage metrics is available 48-96 hours after online publication and is updated daily on week days.
Initial download of the metrics may take a while.