Fig. 9
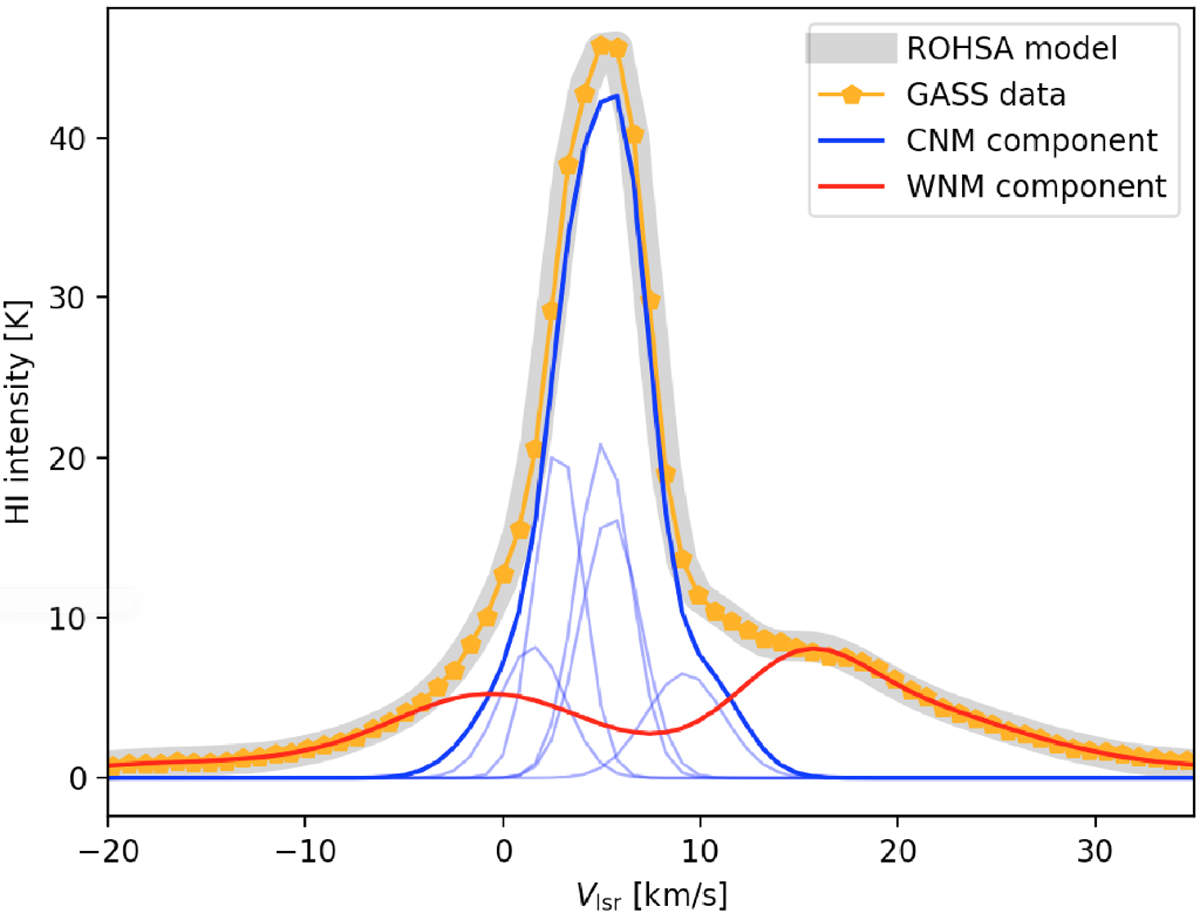
Example of Gaussian decomposition of ROHSA for one given line of sight in the red box of Fig. 8. GASS data are shown in orange, the reconstructed modeled spectrum from ROHSA is shown in gray shade, the total CNM component is shown in blue, and the WNM component in red. Light-blue curves represent the multiple Gaussians associated with the CNM from ROHSA.
Current usage metrics show cumulative count of Article Views (full-text article views including HTML views, PDF and ePub downloads, according to the available data) and Abstracts Views on Vision4Press platform.
Data correspond to usage on the plateform after 2015. The current usage metrics is available 48-96 hours after online publication and is updated daily on week days.
Initial download of the metrics may take a while.