Fig. 8
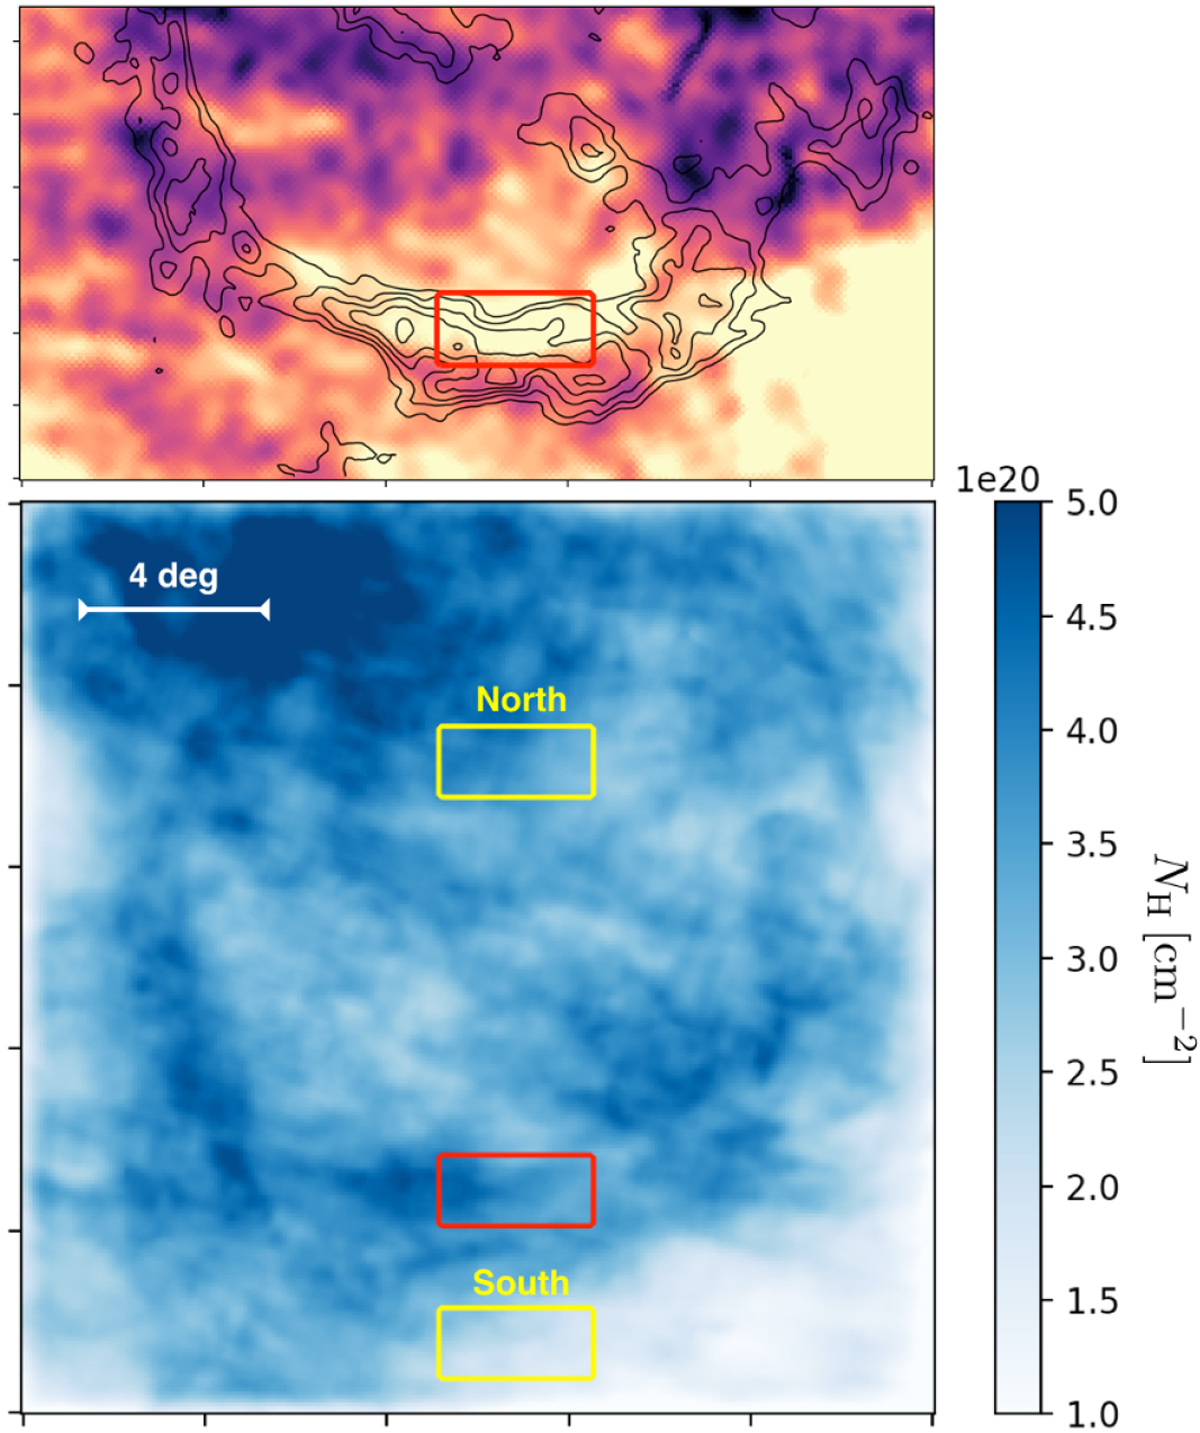
Top panel: blow-up of the p map shown in the top-right panel of Fig. 6 showing in more detail the red box where weestimated the magnetic-field strength of the C.1 shell. Bottom panel: column density map, NH, of the CNM isolated with ROHSA. This is the same field of view shown in Fig. 6. Beside the red box shown in the top panel we also indicate two yellow boxes where we estimate the magnetic-field strength and compare it with C.1.
Current usage metrics show cumulative count of Article Views (full-text article views including HTML views, PDF and ePub downloads, according to the available data) and Abstracts Views on Vision4Press platform.
Data correspond to usage on the plateform after 2015. The current usage metrics is available 48-96 hours after online publication and is updated daily on week days.
Initial download of the metrics may take a while.