Fig. 6
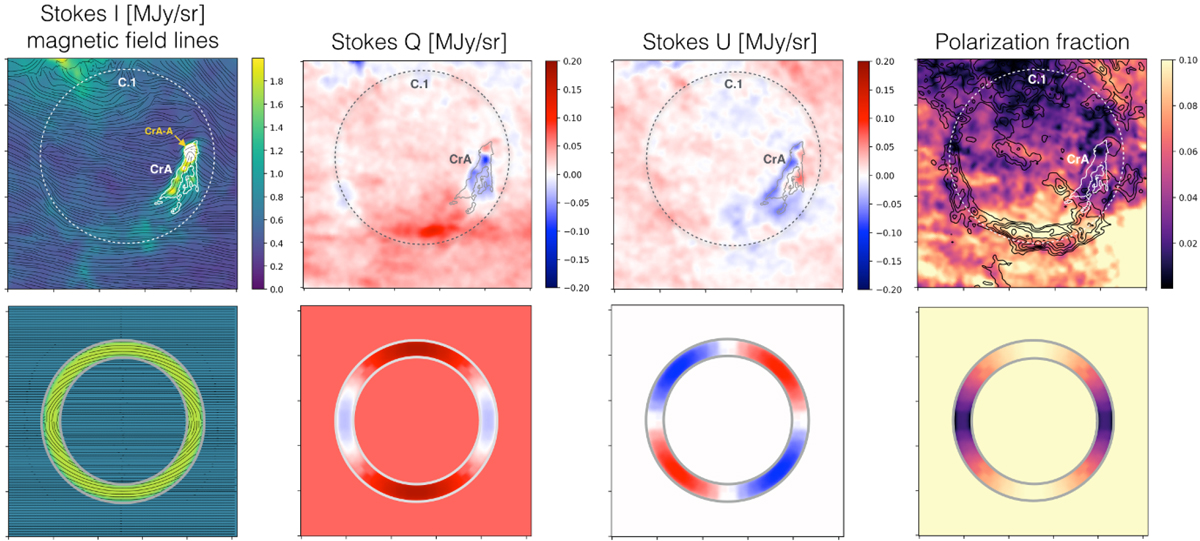
Magnetic-field morphology of the C.1 shell. Comparison between Planck polarization data (top row) and the Stokes parameters produced with a toy model (bottom row) describing the magnetic-field geometry compressed on the surface of a shell seen in projection (in yellow). Units and dynamic range in both rows are the same. Top right panel: we overlay on the polarization-fraction map (right panel) black contours of HI emission at 30, 35, 40, 45, and 50 K tracing the 7.4 km s−1 component of C.1 (dashed-line circle in all panels). The position of the CrA molecular cloud is shown with white (left and right panels) and gray (central panels) contours of
![]() at 4 × 1021 cm−2. The location of the Coronet cluster (CrA-A) is marked in yellow in the left panel. Top row: field of view is 20 × 20 deg2 centered in Galactic coordinates of (l, b) = (6°, −20°).
at 4 × 1021 cm−2. The location of the Coronet cluster (CrA-A) is marked in yellow in the left panel. Top row: field of view is 20 × 20 deg2 centered in Galactic coordinates of (l, b) = (6°, −20°).
Current usage metrics show cumulative count of Article Views (full-text article views including HTML views, PDF and ePub downloads, according to the available data) and Abstracts Views on Vision4Press platform.
Data correspond to usage on the plateform after 2015. The current usage metrics is available 48-96 hours after online publication and is updated daily on week days.
Initial download of the metrics may take a while.