Free Access
Fig. 4
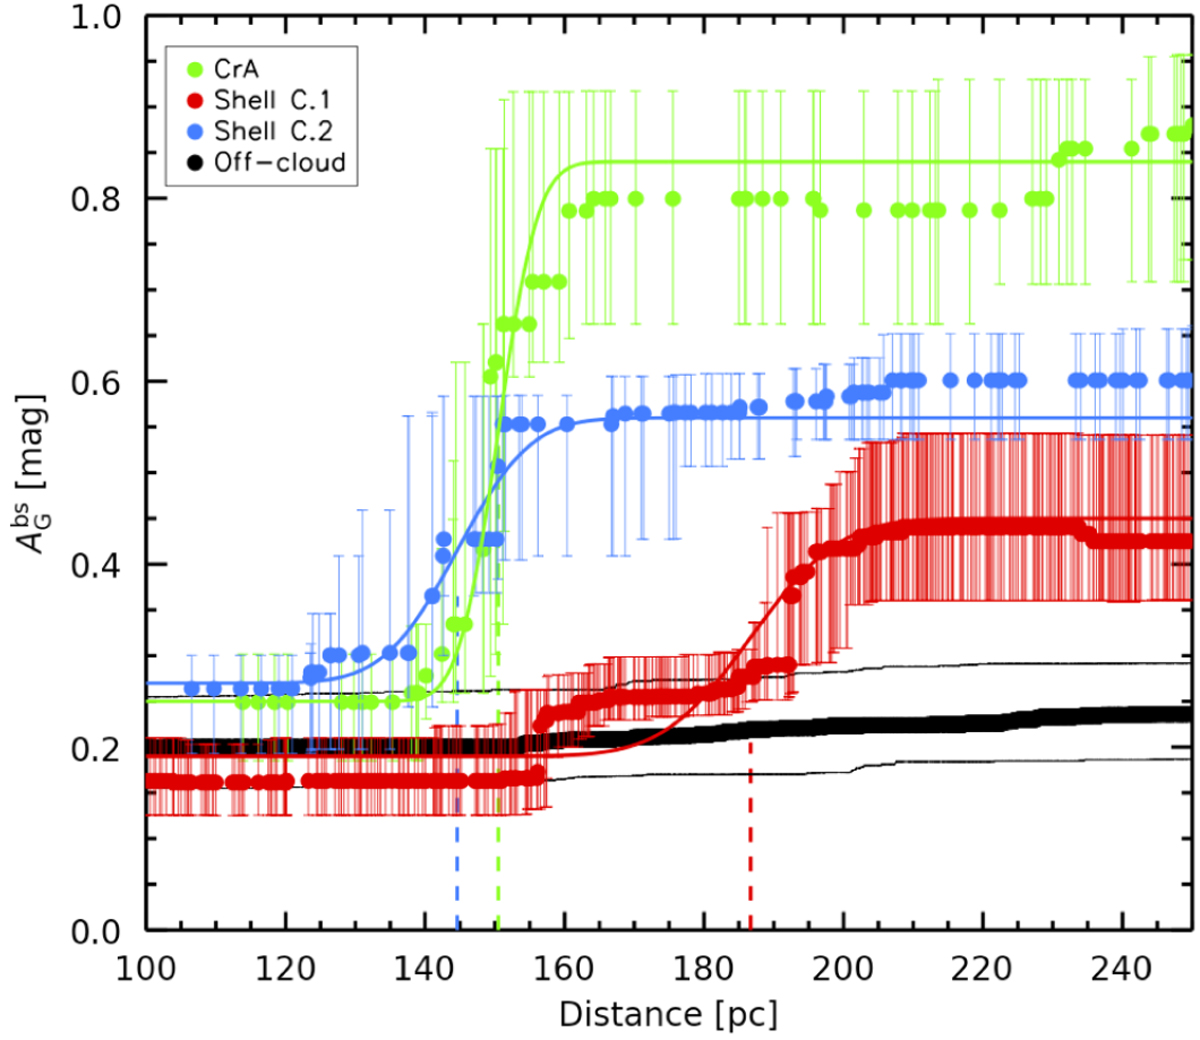
Median ![]() values and their errors as a function of distance derived from bootstrapping method (see main text), for Gaia DR2 stars observed toward CrA, C.1, C.2 and off-cloud regions in green, red, blue and black, respectively. The best fit curve for each region is shown with solid lines and corresponding colors.
values and their errors as a function of distance derived from bootstrapping method (see main text), for Gaia DR2 stars observed toward CrA, C.1, C.2 and off-cloud regions in green, red, blue and black, respectively. The best fit curve for each region is shown with solid lines and corresponding colors.
Current usage metrics show cumulative count of Article Views (full-text article views including HTML views, PDF and ePub downloads, according to the available data) and Abstracts Views on Vision4Press platform.
Data correspond to usage on the plateform after 2015. The current usage metrics is available 48-96 hours after online publication and is updated daily on week days.
Initial download of the metrics may take a while.