Fig. 3
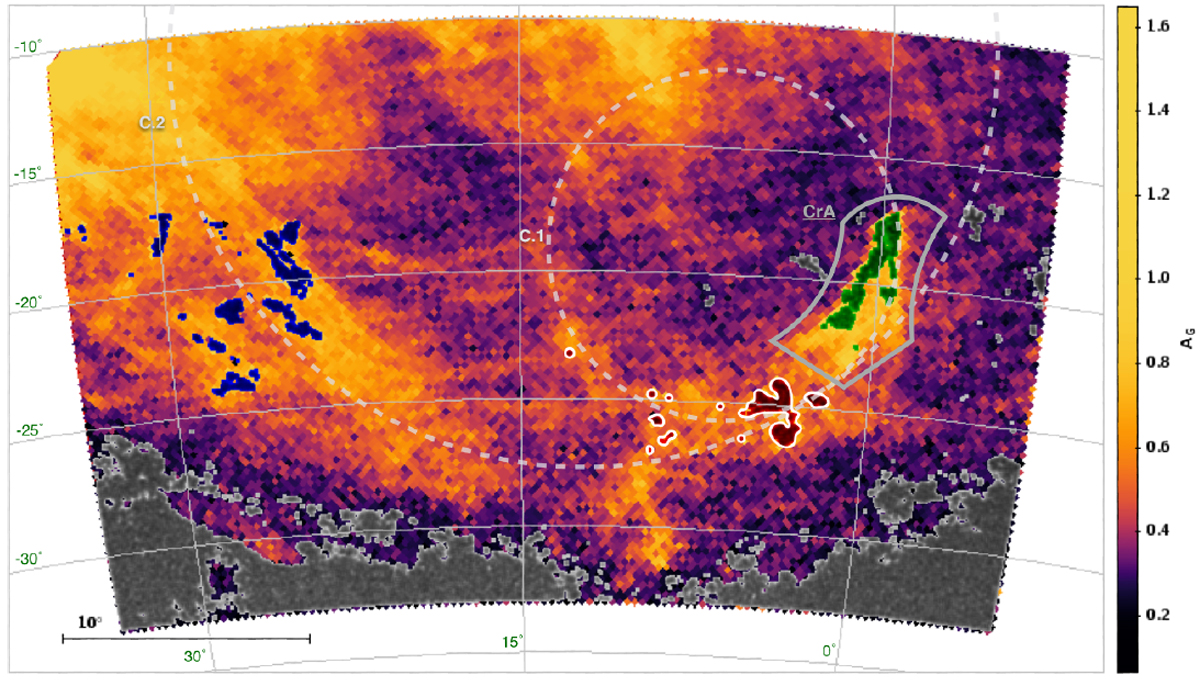
Surface density map in galactic coordinates of the median AG values of the sample of 1 826 578 Gaia DR2 stars covering the same field of view as Fig. 1. The positions of the Gaia sources used to estimate the distance of CrA, C.1 and C.2, are overlaid in green, red (with white contours) and blue, respectively. The off position is shown in gray. CrA, C.1, and C.2 are shown as in Fig. 1.
Current usage metrics show cumulative count of Article Views (full-text article views including HTML views, PDF and ePub downloads, according to the available data) and Abstracts Views on Vision4Press platform.
Data correspond to usage on the plateform after 2015. The current usage metrics is available 48-96 hours after online publication and is updated daily on week days.
Initial download of the metrics may take a while.