Free Access
Fig. A.1
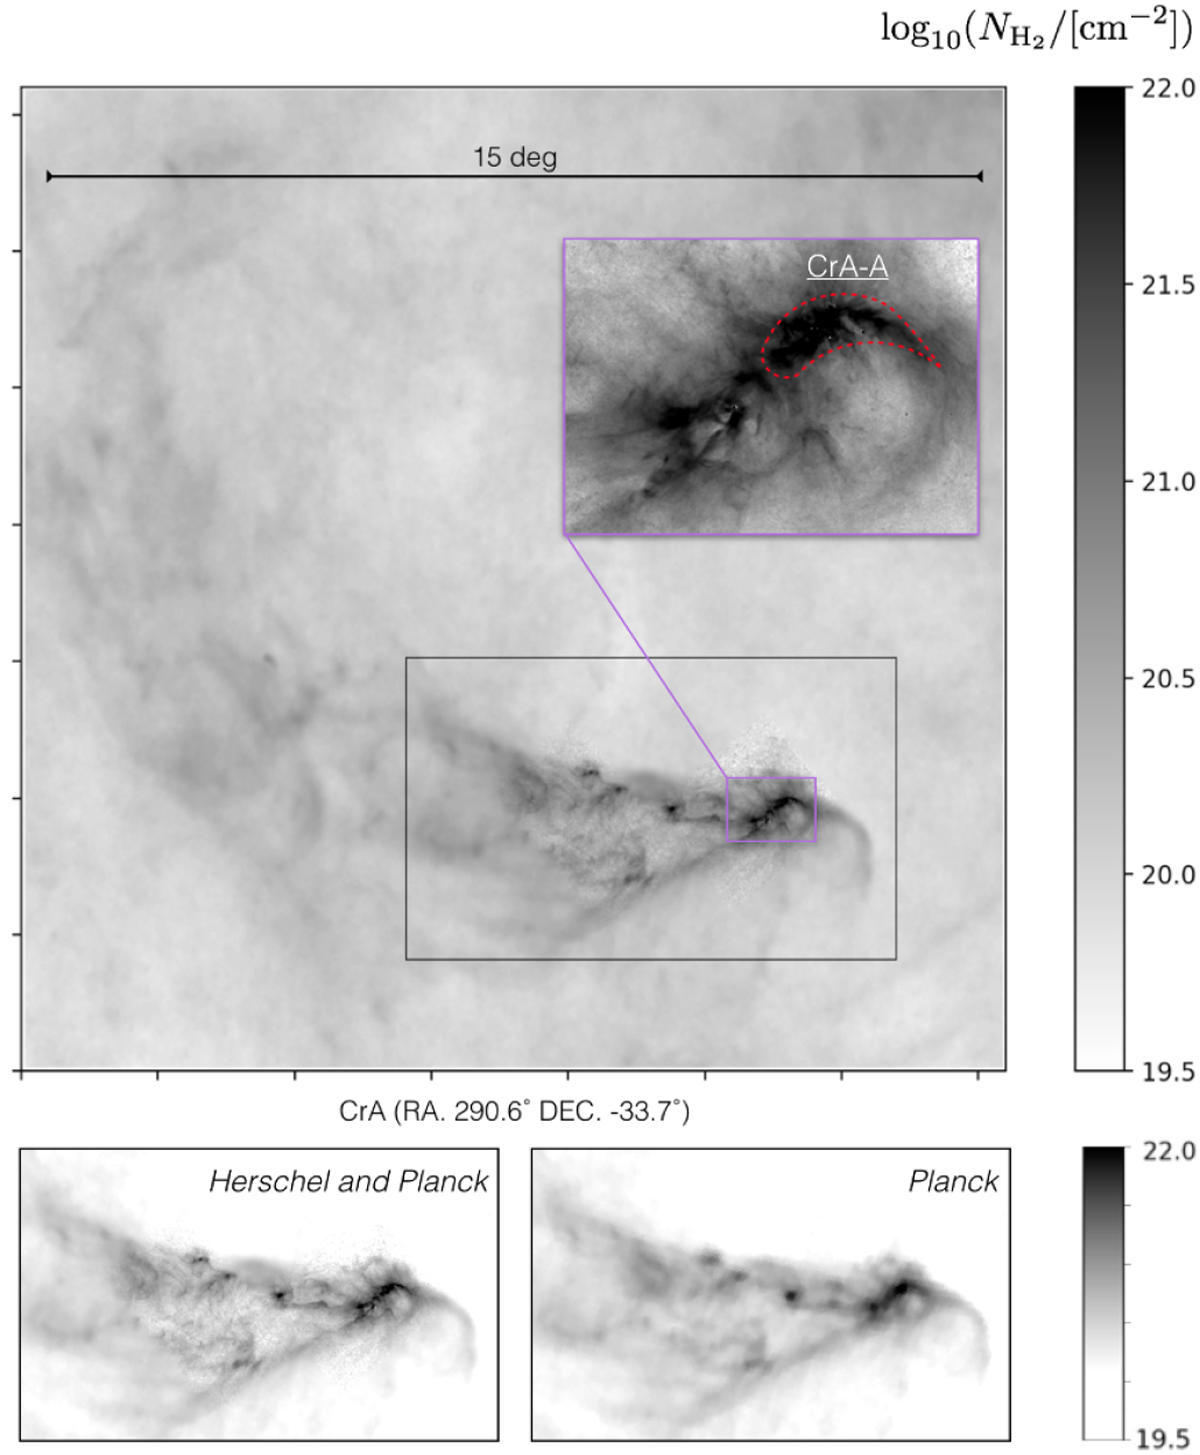
Herschel-Planck ![]() map showing the comparison between the combined
map showing the comparison between the combined ![]() map and the Planck alone one (see two bottom panels). The purple blow-up in the top panel shows the most active star-formingregion of CrA, namely CrA-A (dashed-red contour) as described in Bresnahan et al. (2018).
map and the Planck alone one (see two bottom panels). The purple blow-up in the top panel shows the most active star-formingregion of CrA, namely CrA-A (dashed-red contour) as described in Bresnahan et al. (2018).
Current usage metrics show cumulative count of Article Views (full-text article views including HTML views, PDF and ePub downloads, according to the available data) and Abstracts Views on Vision4Press platform.
Data correspond to usage on the plateform after 2015. The current usage metrics is available 48-96 hours after online publication and is updated daily on week days.
Initial download of the metrics may take a while.