Fig. 1
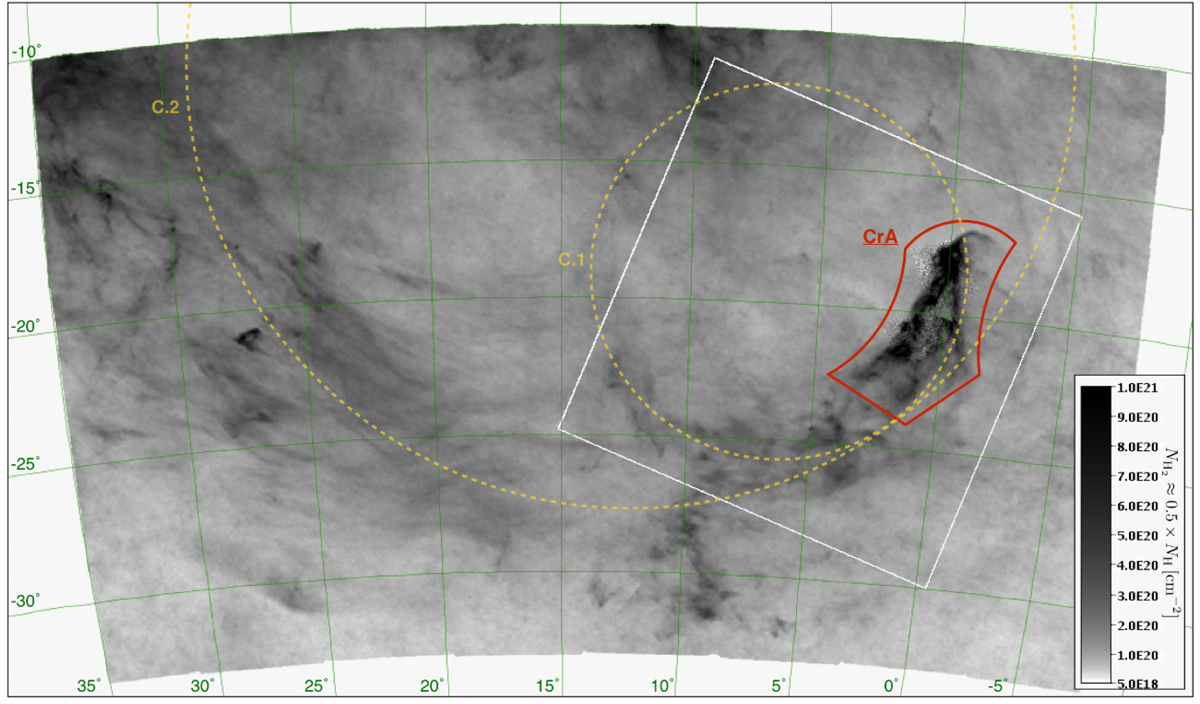
Stereographic projection of the multi-resolution gas column density map of CrA and its surroundings from Herschel and Planck (named ![]() in this work). The map has an angular resolution of 5′ where the dust emission is covered only by Planck, while of 18′′ where it is also covered by Herschel (within the red contour). The grayscale bar on the right gives the scaling of the grayscale image in terms of
in this work). The map has an angular resolution of 5′ where the dust emission is covered only by Planck, while of 18′′ where it is also covered by Herschel (within the red contour). The grayscale bar on the right gives the scaling of the grayscale image in terms of ![]() . Yellow dashed lines (labeled as C.1 and C.2) trace the two shell-like structures associated with CrA. The white square represents the blow-up shown in Appendix A. A grid of Galactic coordinates is overlaid. This figure was adapted from the Aladin sky-viewer (Boch & Fernique 2014).
. Yellow dashed lines (labeled as C.1 and C.2) trace the two shell-like structures associated with CrA. The white square represents the blow-up shown in Appendix A. A grid of Galactic coordinates is overlaid. This figure was adapted from the Aladin sky-viewer (Boch & Fernique 2014).
Current usage metrics show cumulative count of Article Views (full-text article views including HTML views, PDF and ePub downloads, according to the available data) and Abstracts Views on Vision4Press platform.
Data correspond to usage on the plateform after 2015. The current usage metrics is available 48-96 hours after online publication and is updated daily on week days.
Initial download of the metrics may take a while.