Fig. B.1
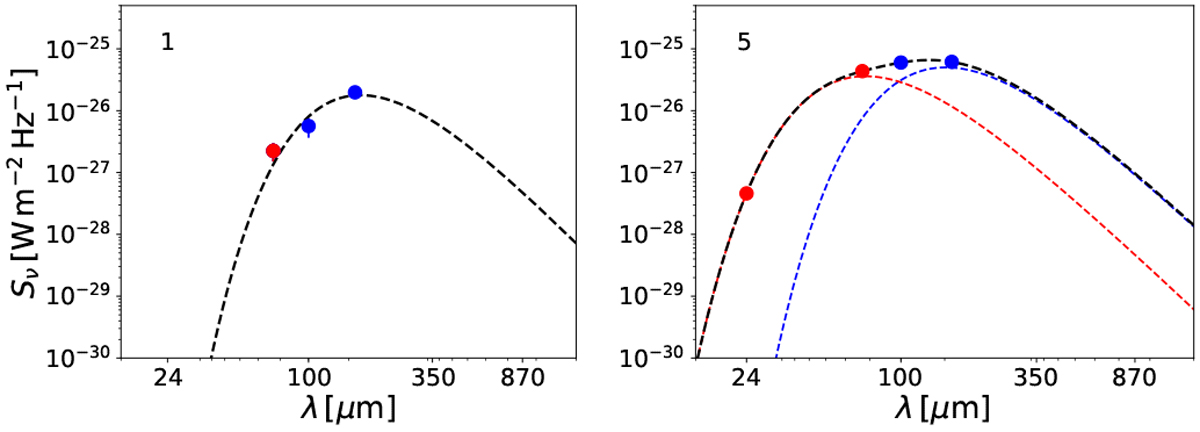
Two examples of SEDs of dense cores in the Snake IRDC. Core 1 (left panel) is 24 μm dark, while core 5 (right panel) is associated with a 24 μm source. Datapoints at λ ≤ 70 μm are highlighted in red, while the longer wavelength data are shown in blue. The black, dashed lines represent the best modified blackbody fits to the data. For core 5, the latter represents the sum of the cold and warm components, where the individual fits are shown by the blue and red dashed lines, respectively.
Current usage metrics show cumulative count of Article Views (full-text article views including HTML views, PDF and ePub downloads, according to the available data) and Abstracts Views on Vision4Press platform.
Data correspond to usage on the plateform after 2015. The current usage metrics is available 48-96 hours after online publication and is updated daily on week days.
Initial download of the metrics may take a while.