Fig. A.1
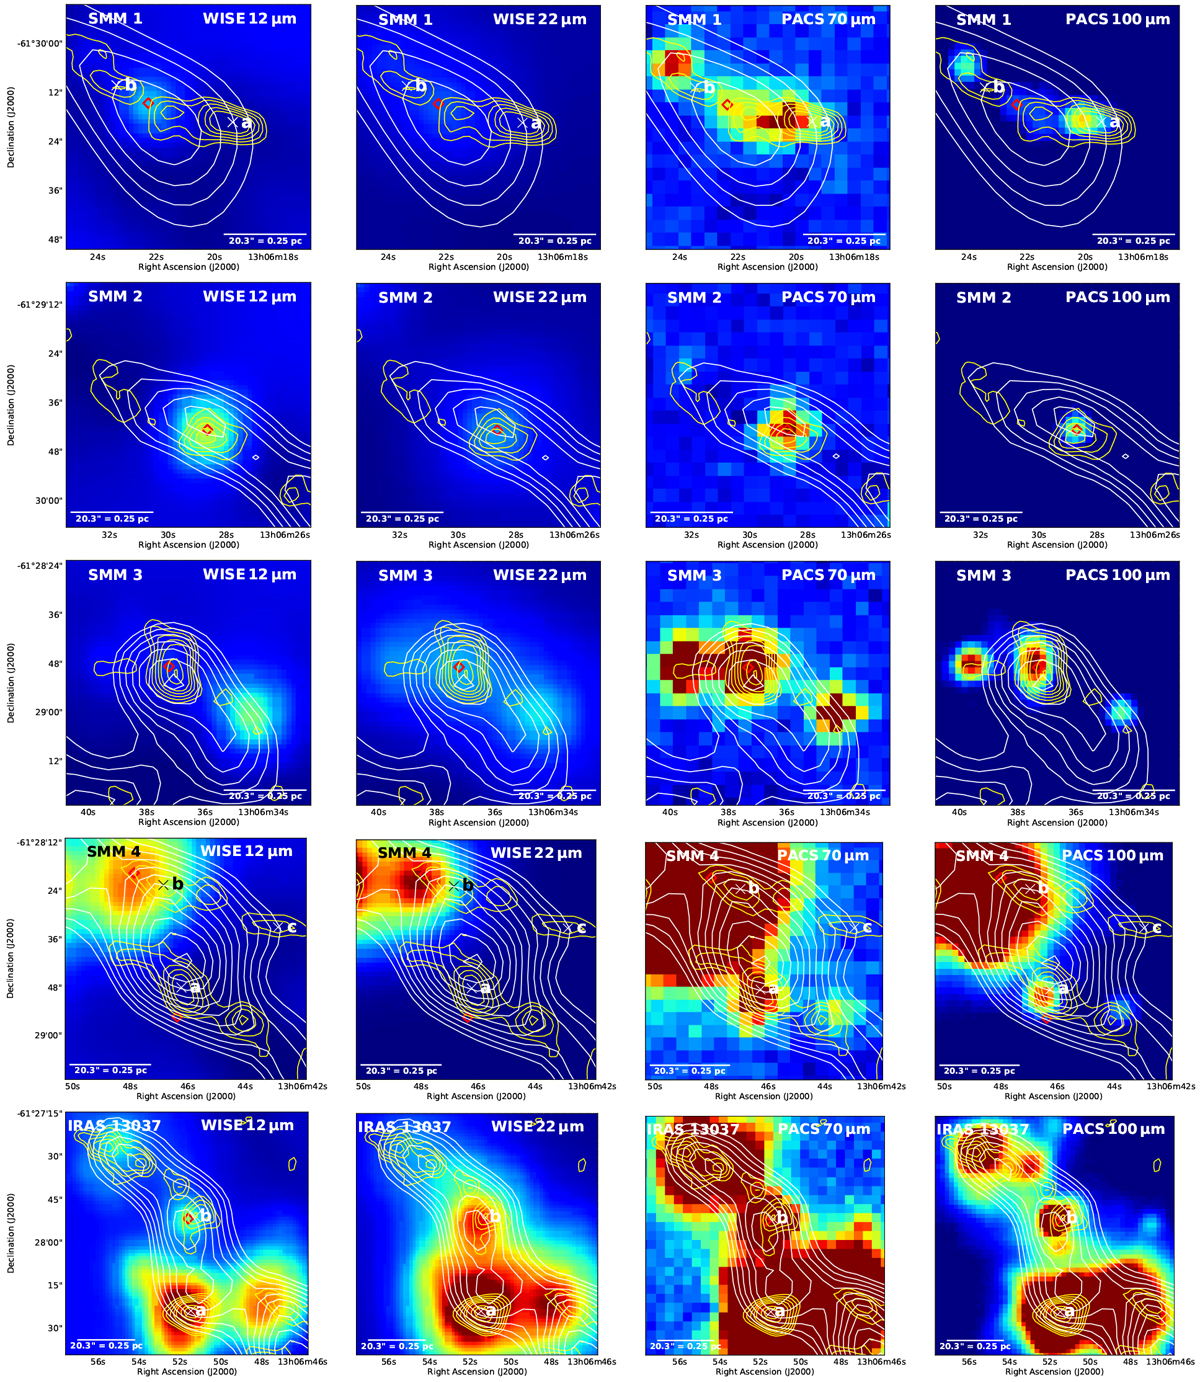
Multiwavelength images towards the target cores (WISE 12 and 22 μm and Herschel/PACS 70 and 100 μm). The WISE images are shown with logarithmic scaling except the 22 μm images of SMM 7 and SMM 9 that are shown with power-law scaling to enhance the colour contrast. The PACS images are displayed using a linear stretch. In each panel, the overlaid yellow contours show the SABOCA 350 μm dust continuum emission and the white contours show the LABOCA 870 μm emission. The contour levels start from 3σ, and progressin steps of 1σ, where 1σ = 200 mJy beam−1 for the SABOCA data and 1σ = 40 mJy beam−1 for the LABOCA data (Miettinen 2018). Each image is centred on the LABOCA peak position of the parent clump, and is 60′′ × 60′′ in size with the exception of the IRAS 13037 and IRAS 13039 images, which are 85′′ on a side. In those cases where the LABOCA clump contains more than one SABOCA core (e.g. components a and b), the crosses indicate the 350 μm peak positions of the cores. The red diamond symbols show the WISE source positions (see Miettinen 2018, Table 3 therein). The plus sign in the IRAS 13039 image indicates the position of the 18 and 22.8 GHz radio continuum source found by Sánchez-Monge et al. (2013). A scale bar of 0.25 pc is shown in each panel.
Current usage metrics show cumulative count of Article Views (full-text article views including HTML views, PDF and ePub downloads, according to the available data) and Abstracts Views on Vision4Press platform.
Data correspond to usage on the plateform after 2015. The current usage metrics is available 48-96 hours after online publication and is updated daily on week days.
Initial download of the metrics may take a while.