Free Access
Fig. 7
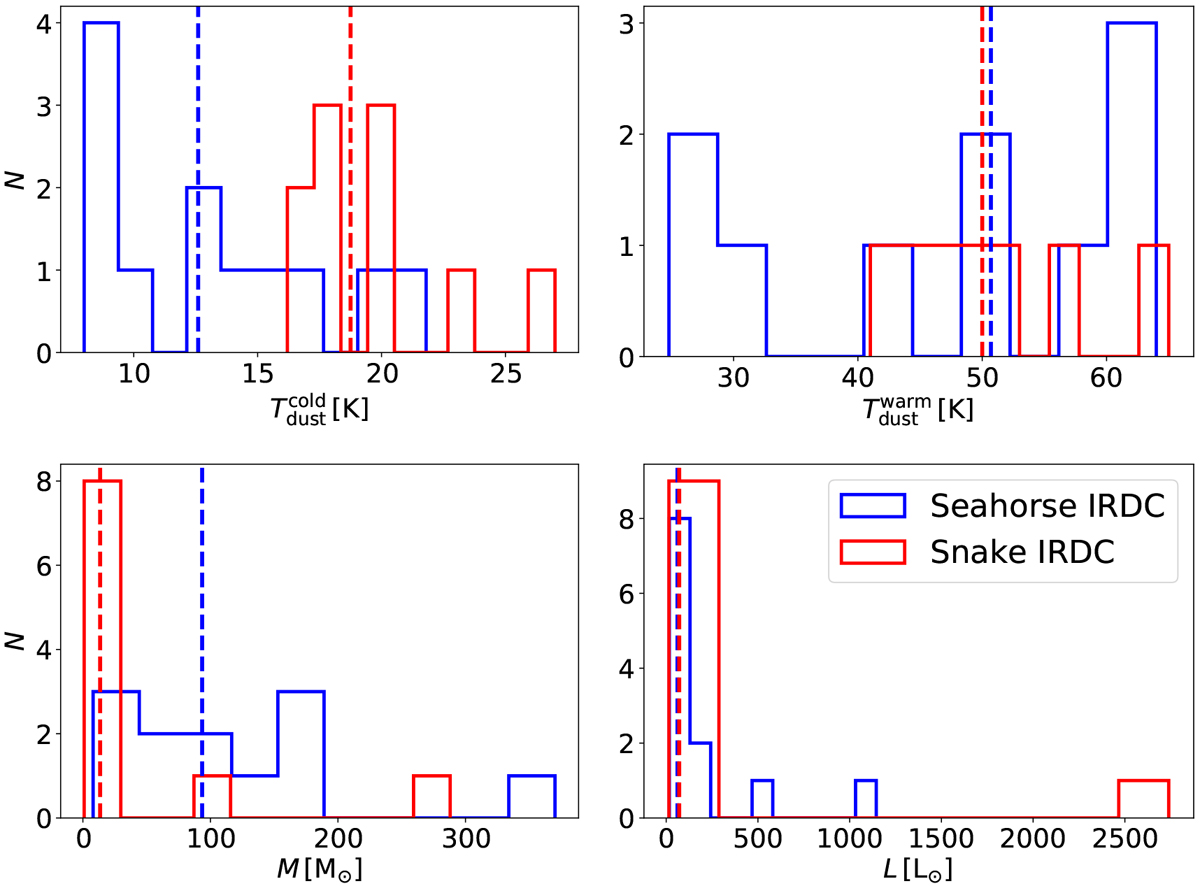
Distributions of dust temperature, mass, and luminosity of the cores in the Seahorse IRDC (blue histogram; present study) and Snake IRDC (red histogram; Henning et al. 2010; Appendix B herein). The vertical dashed lines indicate the sample medians.
Current usage metrics show cumulative count of Article Views (full-text article views including HTML views, PDF and ePub downloads, according to the available data) and Abstracts Views on Vision4Press platform.
Data correspond to usage on the plateform after 2015. The current usage metrics is available 48-96 hours after online publication and is updated daily on week days.
Initial download of the metrics may take a while.