Fig. 5
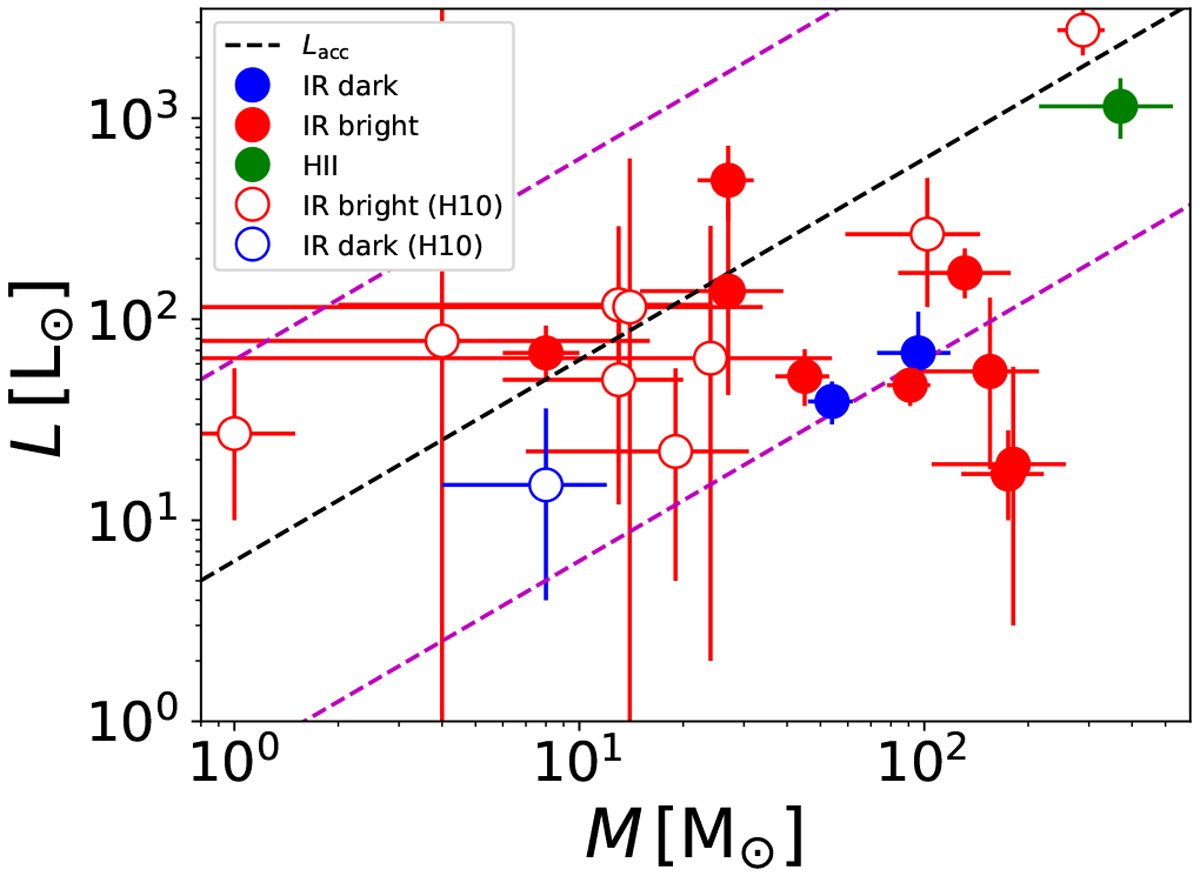
Core luminosity plotted against the core mass. For comparison, a sample of ten IR dark and IR bright cores in the Snake IRDC from Henning et al. (2010) are shown with empty circles (see Sect. 4.3 and Appendix B). The black dashed line shows the accretion luminosity with a mass accretion rate of Ṁacc = 10−5 M⊙ yr−1 and assuming a stellar mass of M⋆ = 0.1 × Mcore and stellar radius of R⋆ = 5 R⊙ (see Eq. (8)). The magenta dashed lines above and below the aforementioned line show a ± 1 dex variation of the accretion luminosity in question.
Current usage metrics show cumulative count of Article Views (full-text article views including HTML views, PDF and ePub downloads, according to the available data) and Abstracts Views on Vision4Press platform.
Data correspond to usage on the plateform after 2015. The current usage metrics is available 48-96 hours after online publication and is updated daily on week days.
Initial download of the metrics may take a while.