Fig. 3
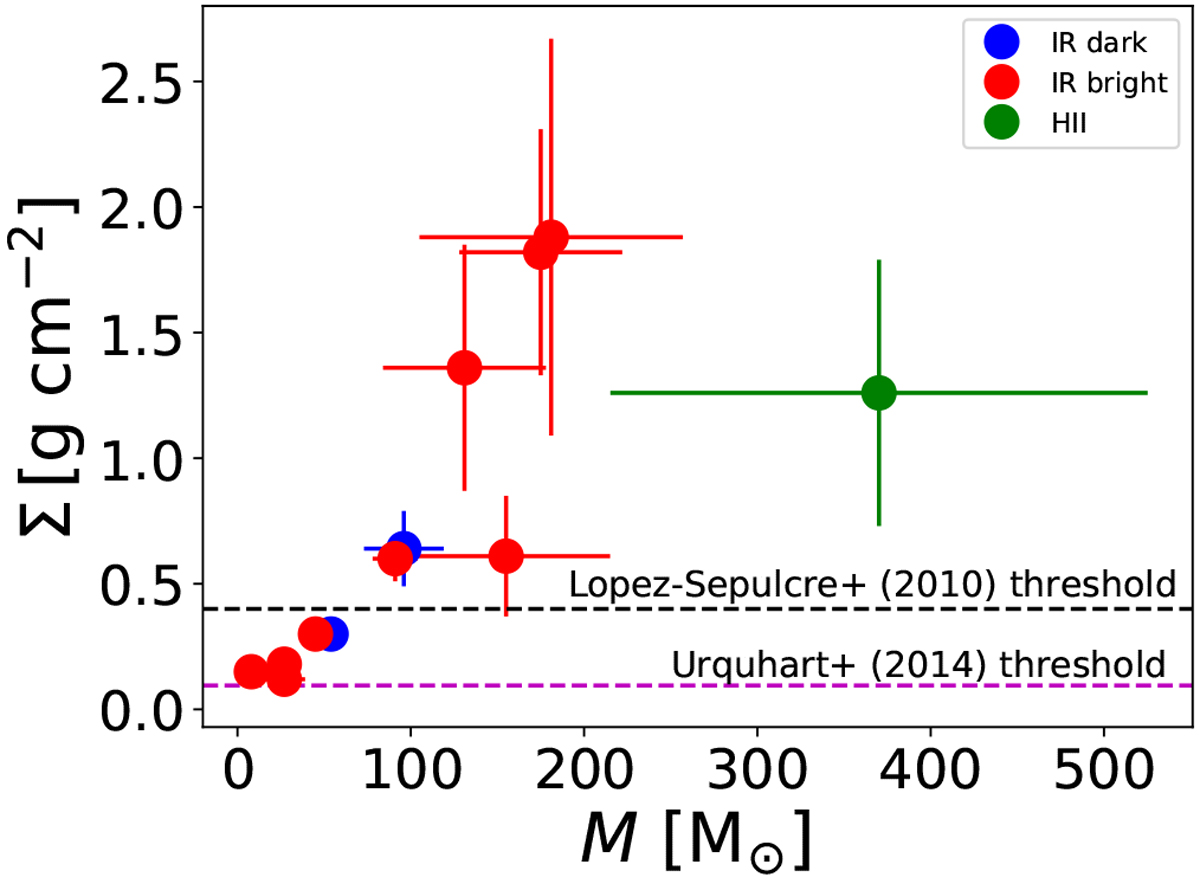
Surface density as a function of core mass. The IR dark cores (no WISE counterpart) are shown by blue data points, while the red data points show the IR bright cores (cores with a WISE counterpart). The H II region IRAS 13037-6112a is indicated by a green data point. The two horizontal dashed lines show the threshold surface densities for high-mass star formation proposed by López-Sepulcre et al. (2010; black) and Urquhart et al. (2014; magenta) when scaled to the present assumptions about the dust properties (see Sect. 4.2).
Current usage metrics show cumulative count of Article Views (full-text article views including HTML views, PDF and ePub downloads, according to the available data) and Abstracts Views on Vision4Press platform.
Data correspond to usage on the plateform after 2015. The current usage metrics is available 48-96 hours after online publication and is updated daily on week days.
Initial download of the metrics may take a while.