Fig. 2
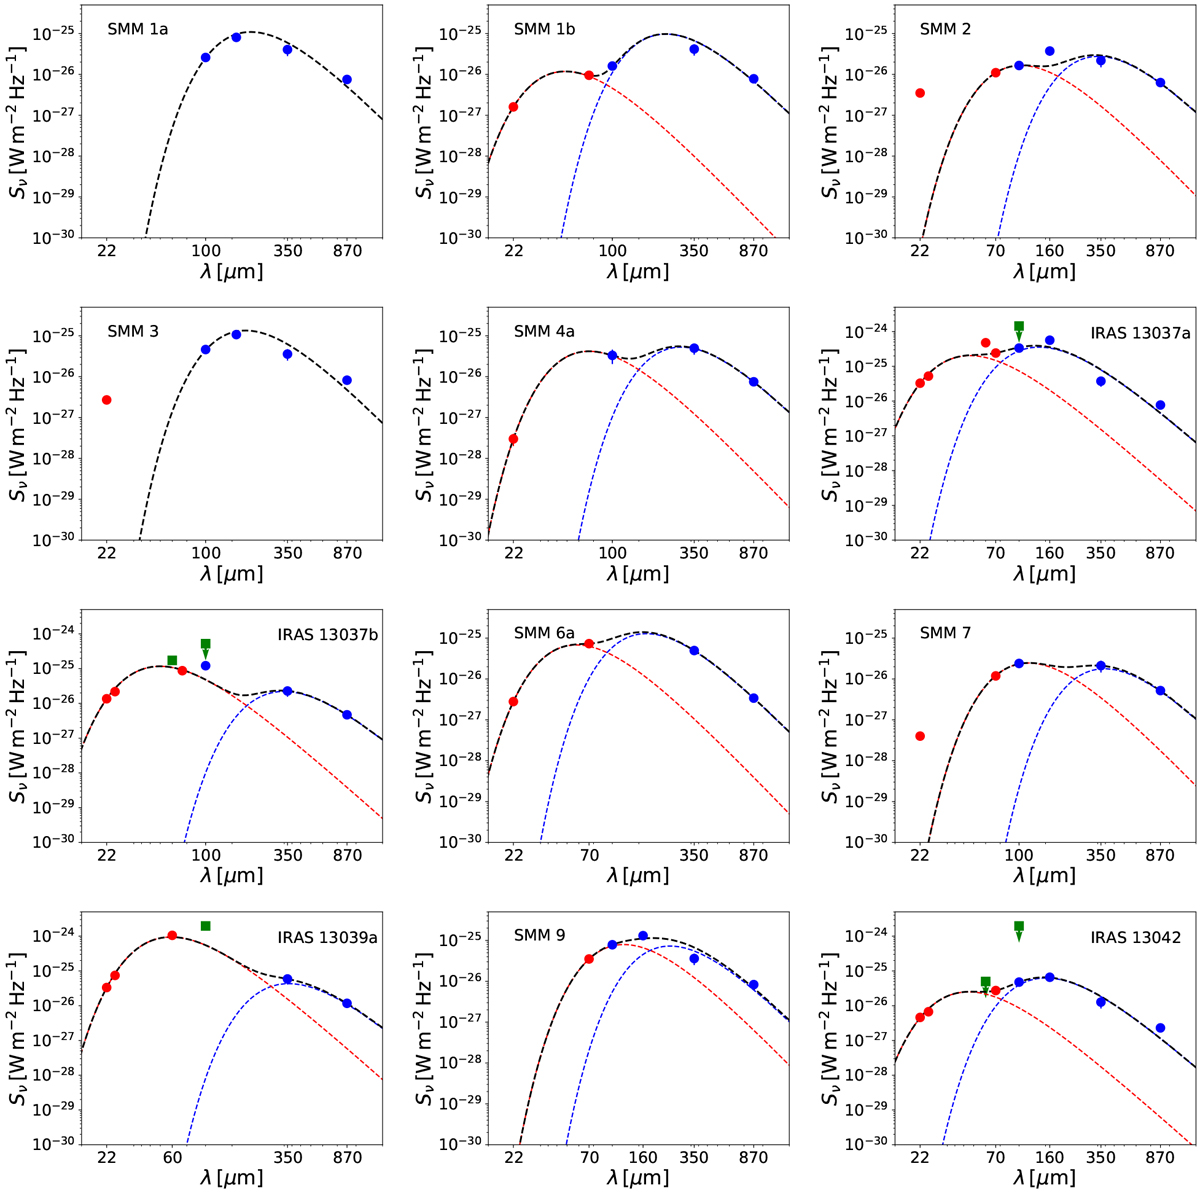
Far-IR to submillimetre SEDs of the analysed cores. Data points at λ ≤ 70 μm are highlighted in red, while the longer wavelength data are shown in blue. The data points shown by green square symbols were not included in the fit (see Sect. 4.1 for details). The downward pointing arrows indicate upper limits (relevant only for some of the IRAS flux densities). The black, dashed lines represent the best modified blackbody fits to the data. For the two-temperature modified blackbody fits, the black, dashed line shows the sum of the two components. The blue and red dashed lines show the SED fits to the cold and warm component, respectively. We note that the y-axis scale is different for the bright IRAS sources compared to the other panels.
Current usage metrics show cumulative count of Article Views (full-text article views including HTML views, PDF and ePub downloads, according to the available data) and Abstracts Views on Vision4Press platform.
Data correspond to usage on the plateform after 2015. The current usage metrics is available 48-96 hours after online publication and is updated daily on week days.
Initial download of the metrics may take a while.