Fig. A.2.
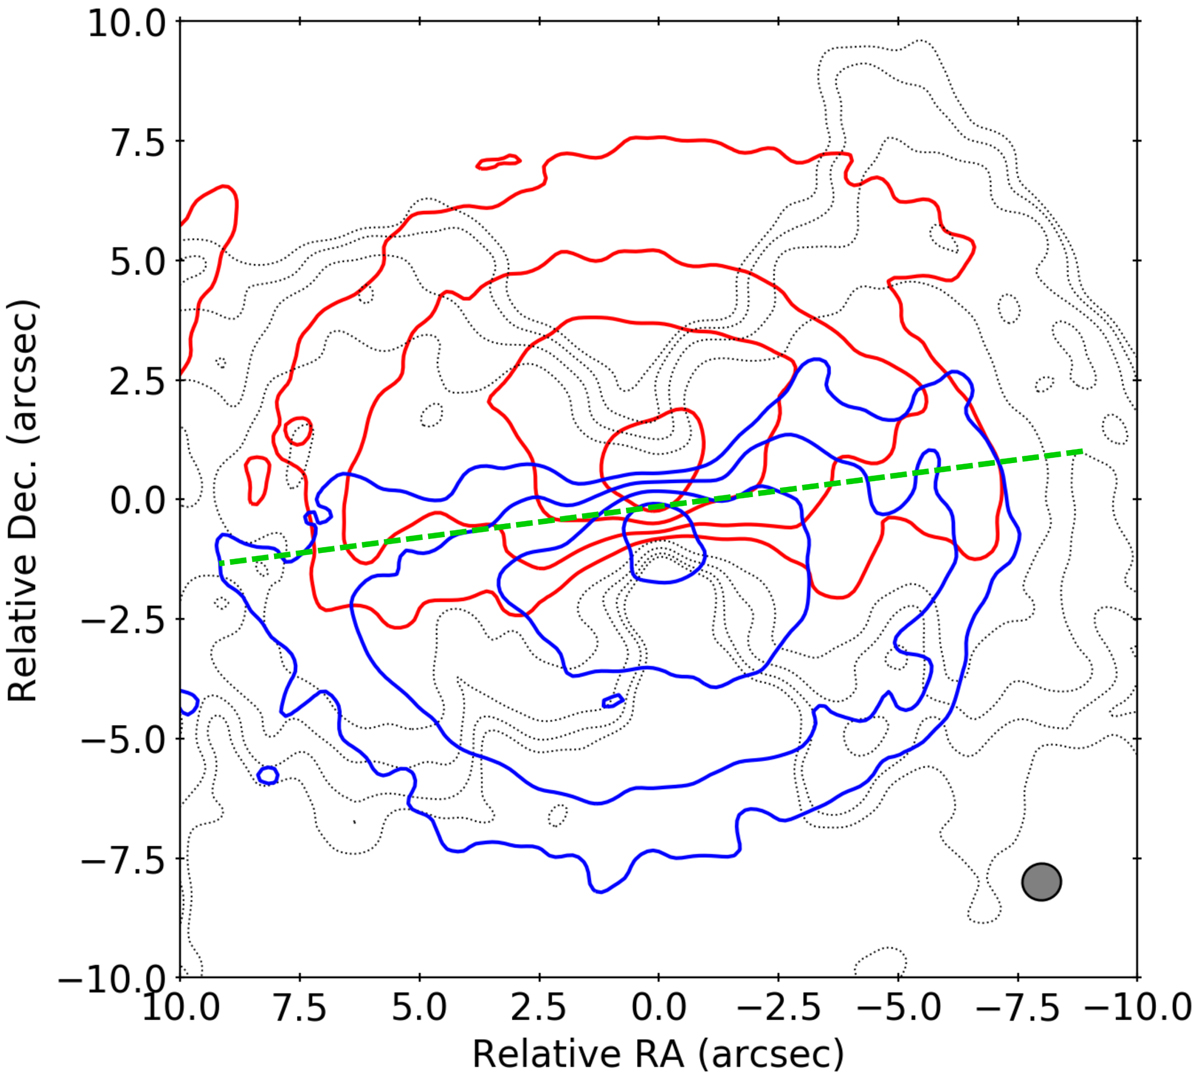
Stereogram of the cube shown in Fig. A.1. Contours are drawn every 3, 6, 12, and 24 times the rms noise value in the spectral region of the bandpass without detectable line emission (σrms = 3.6 × 10⁻³ Jy beam−1). The channel at stellar velocity is shown in black dotted contours, and the mean red (blue)-shifted emission in red (blue). The green dashed line represents the symmetry axis of the map. The ALMA beam is shown in the bottom right (0.807″ × 0.768″).
Current usage metrics show cumulative count of Article Views (full-text article views including HTML views, PDF and ePub downloads, according to the available data) and Abstracts Views on Vision4Press platform.
Data correspond to usage on the plateform after 2015. The current usage metrics is available 48-96 hours after online publication and is updated daily on week days.
Initial download of the metrics may take a while.