Fig. 13.
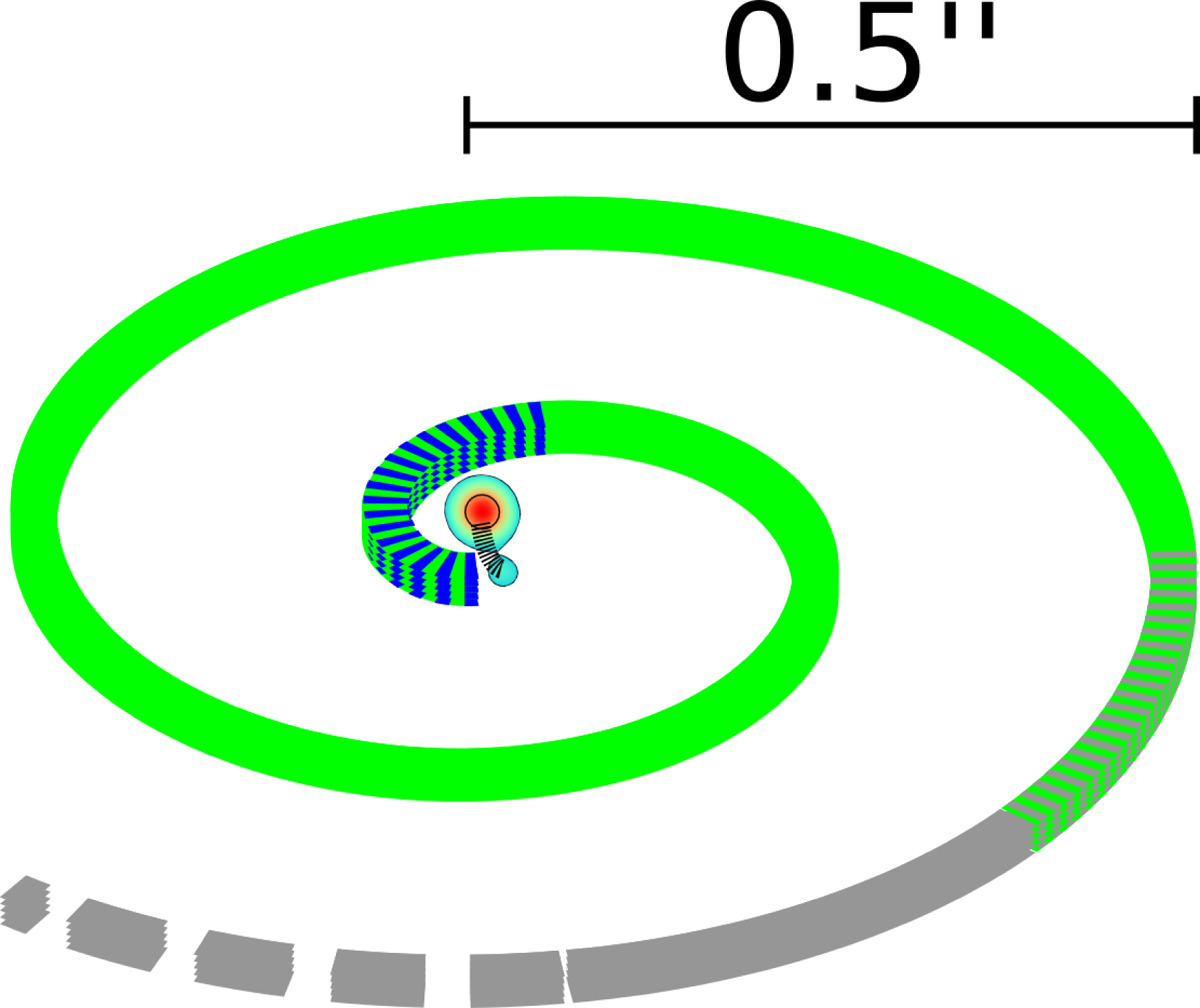
Scematic diagram of the inner wind of π1Gru. In the center is a cut-out of the 120σrms contour of the ALMA continuum, from which the inclined spiral is launched. The colours of the spiral represent the different diagnostics used: blue is the SiO, green is the HCN, grey is the CO emission, and black is the stream of accelerating gas probed by the maser emission. The dashes parts represent regions of overlap.
Current usage metrics show cumulative count of Article Views (full-text article views including HTML views, PDF and ePub downloads, according to the available data) and Abstracts Views on Vision4Press platform.
Data correspond to usage on the plateform after 2015. The current usage metrics is available 48-96 hours after online publication and is updated daily on week days.
Initial download of the metrics may take a while.