Fig. 10.
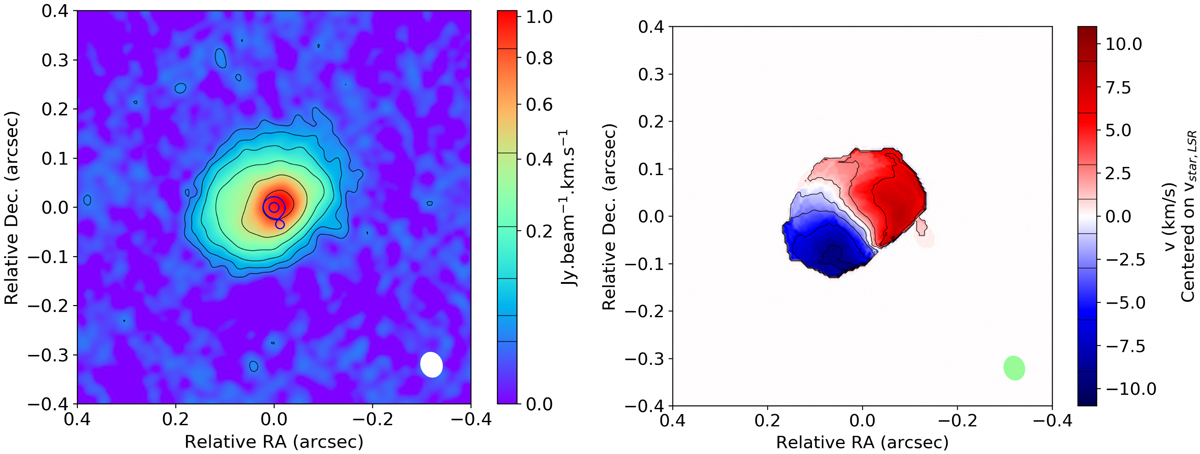
Left: moment 0 map of the emission in the channel maps shown in Fig. 9. Contours are drawn at 3, 6, 12, 24, 48, and 96 times the rms noise value in the spectral region of the bandpass without detectable line emission (σrms = 1.0 × 10⁻³ Jy beam−1). The two highest continuum contours in Fig. 1 are shown in blue. Right: moment1 map of the same emission.
Current usage metrics show cumulative count of Article Views (full-text article views including HTML views, PDF and ePub downloads, according to the available data) and Abstracts Views on Vision4Press platform.
Data correspond to usage on the plateform after 2015. The current usage metrics is available 48-96 hours after online publication and is updated daily on week days.
Initial download of the metrics may take a while.