Fig. 4.
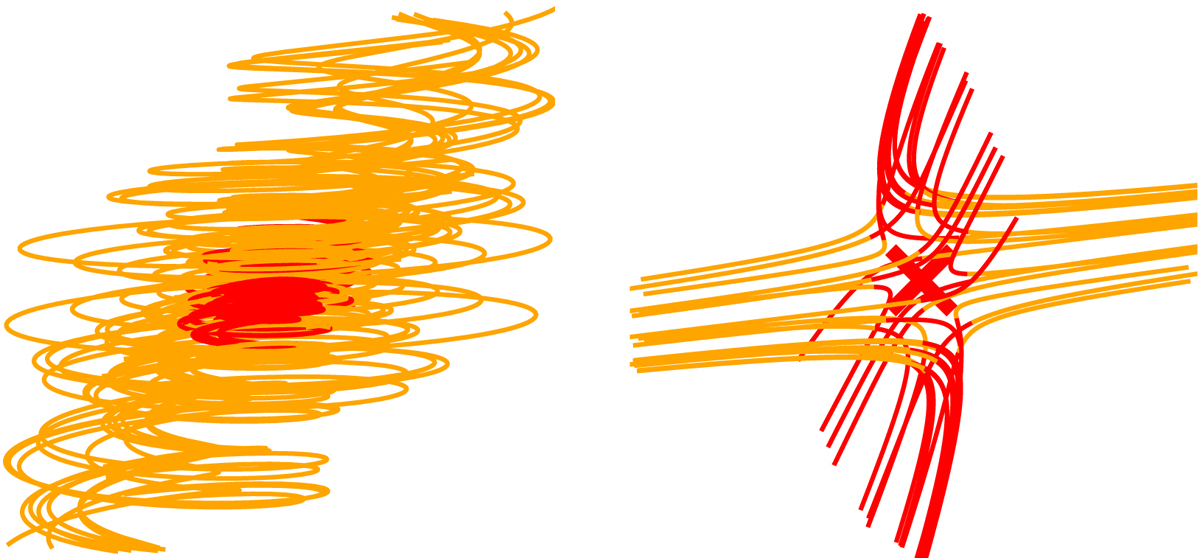
Illustration of the effect of different grid resolution for the reconstructed magnetic field structure using the trilinear method. The magnetic field in the vicinity of the same null point is reconstructed from the 203 grid data (left) and the 303 grid data (right). The reconstructed field structure changes from a sink to a divergence-free null point when the resolution is increased. Red and orange field lines are traced in the forward and backward direction, respectively, of the magnetic field.
Current usage metrics show cumulative count of Article Views (full-text article views including HTML views, PDF and ePub downloads, according to the available data) and Abstracts Views on Vision4Press platform.
Data correspond to usage on the plateform after 2015. The current usage metrics is available 48-96 hours after online publication and is updated daily on week days.
Initial download of the metrics may take a while.