Fig. 3.
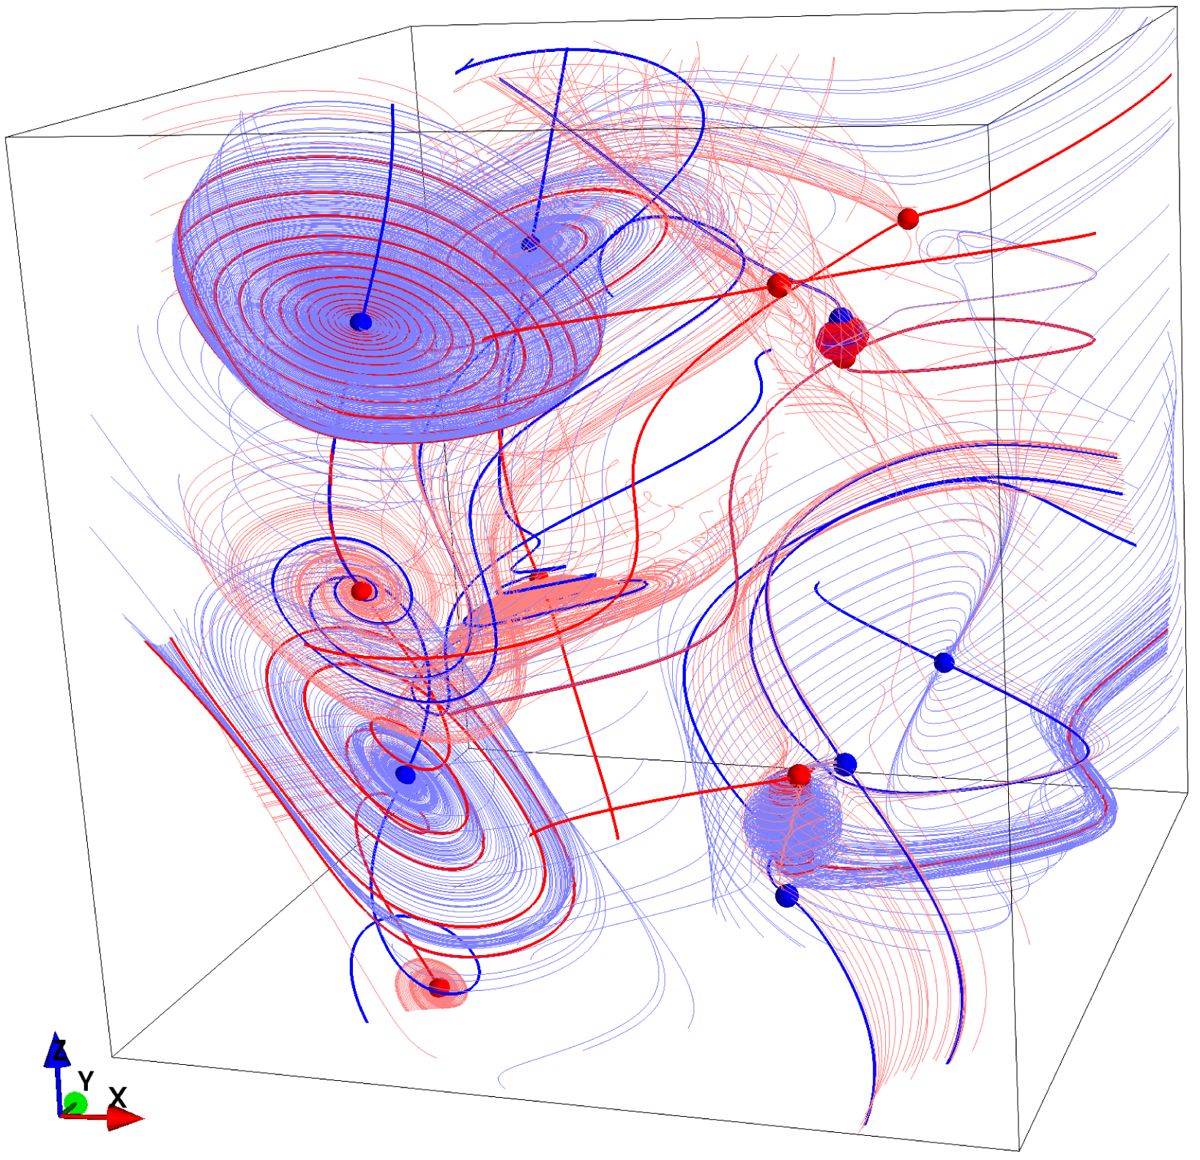
3D rendering of the magnetic field obtained using the trilinear method and associated Magnetic Skeleton Analysis Tools, for 803 resolution. Positive and negative null points are represented as red and blue spheres respectively, spine lines from positive and negative null points are represented as thick red and blue lines respectively and the field lines originating from the fan planes of positive and negative null points are drawn as thinner red and blue lines respectively.
Current usage metrics show cumulative count of Article Views (full-text article views including HTML views, PDF and ePub downloads, according to the available data) and Abstracts Views on Vision4Press platform.
Data correspond to usage on the plateform after 2015. The current usage metrics is available 48-96 hours after online publication and is updated daily on week days.
Initial download of the metrics may take a while.