Free Access
Fig. 6
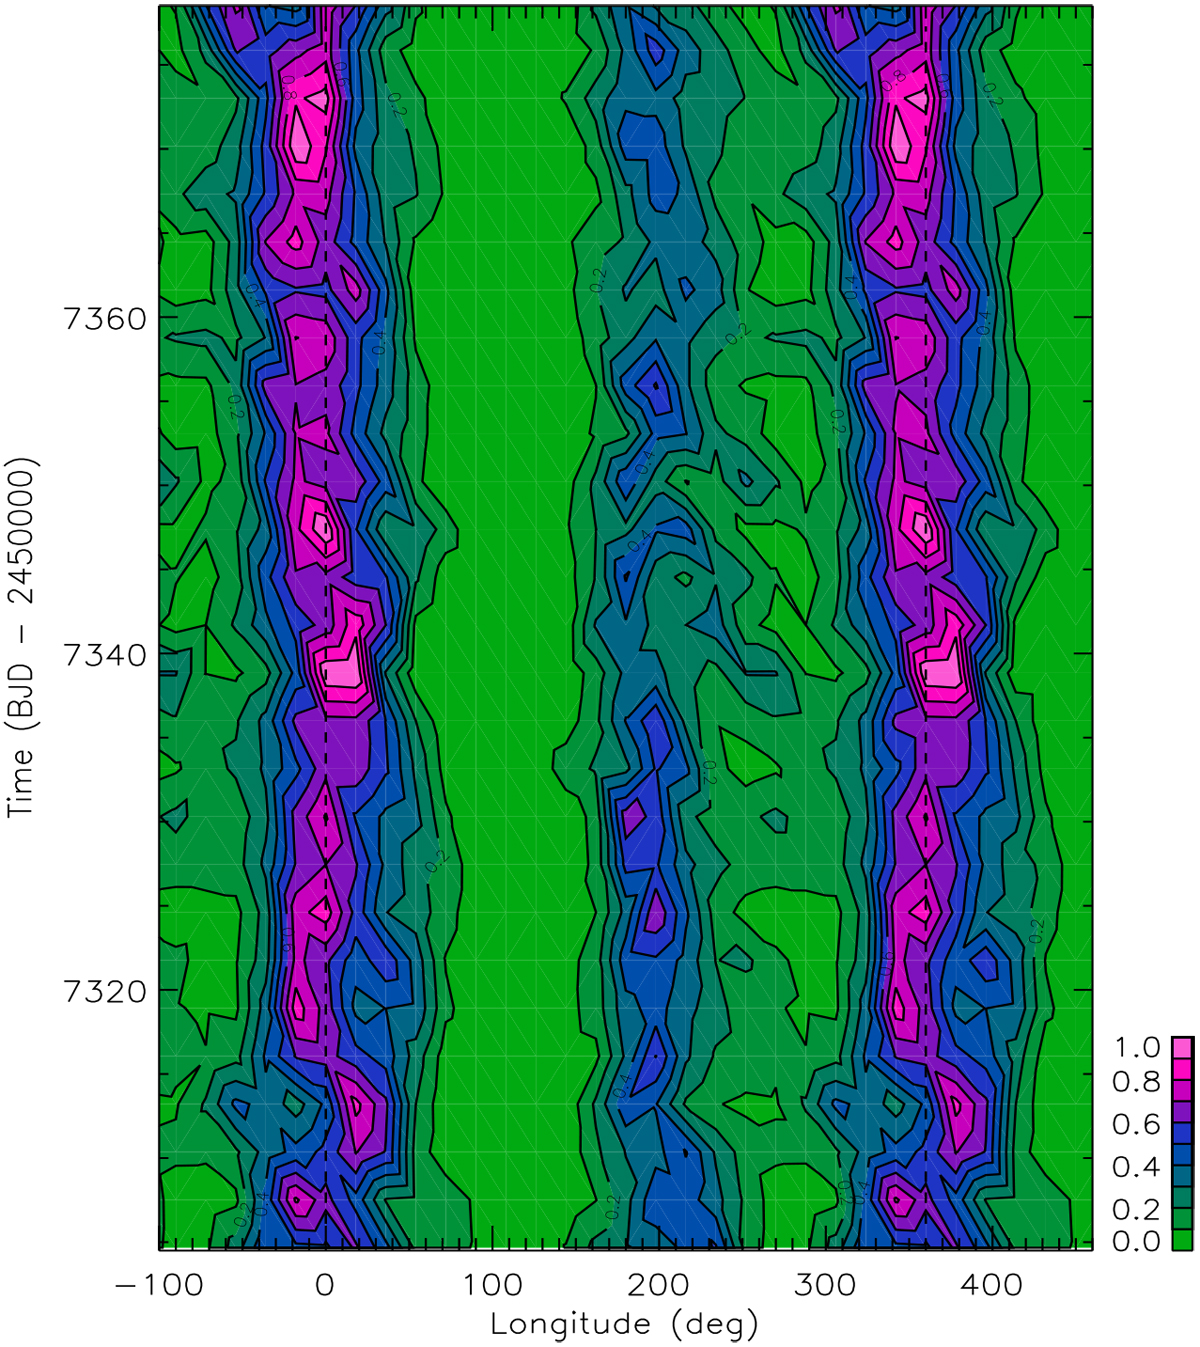
Distribution of the spot filling factor versus longitude and time as derived by our maximum-entropy spot model. The maximum of the filling factor is indicated in purple and the minimum in green (see the color scale in the lower right corner). We note that the longitude scale is repeated beyond the [0°, 360°] interval.
Current usage metrics show cumulative count of Article Views (full-text article views including HTML views, PDF and ePub downloads, according to the available data) and Abstracts Views on Vision4Press platform.
Data correspond to usage on the plateform after 2015. The current usage metrics is available 48-96 hours after online publication and is updated daily on week days.
Initial download of the metrics may take a while.