Free Access
Fig. 14
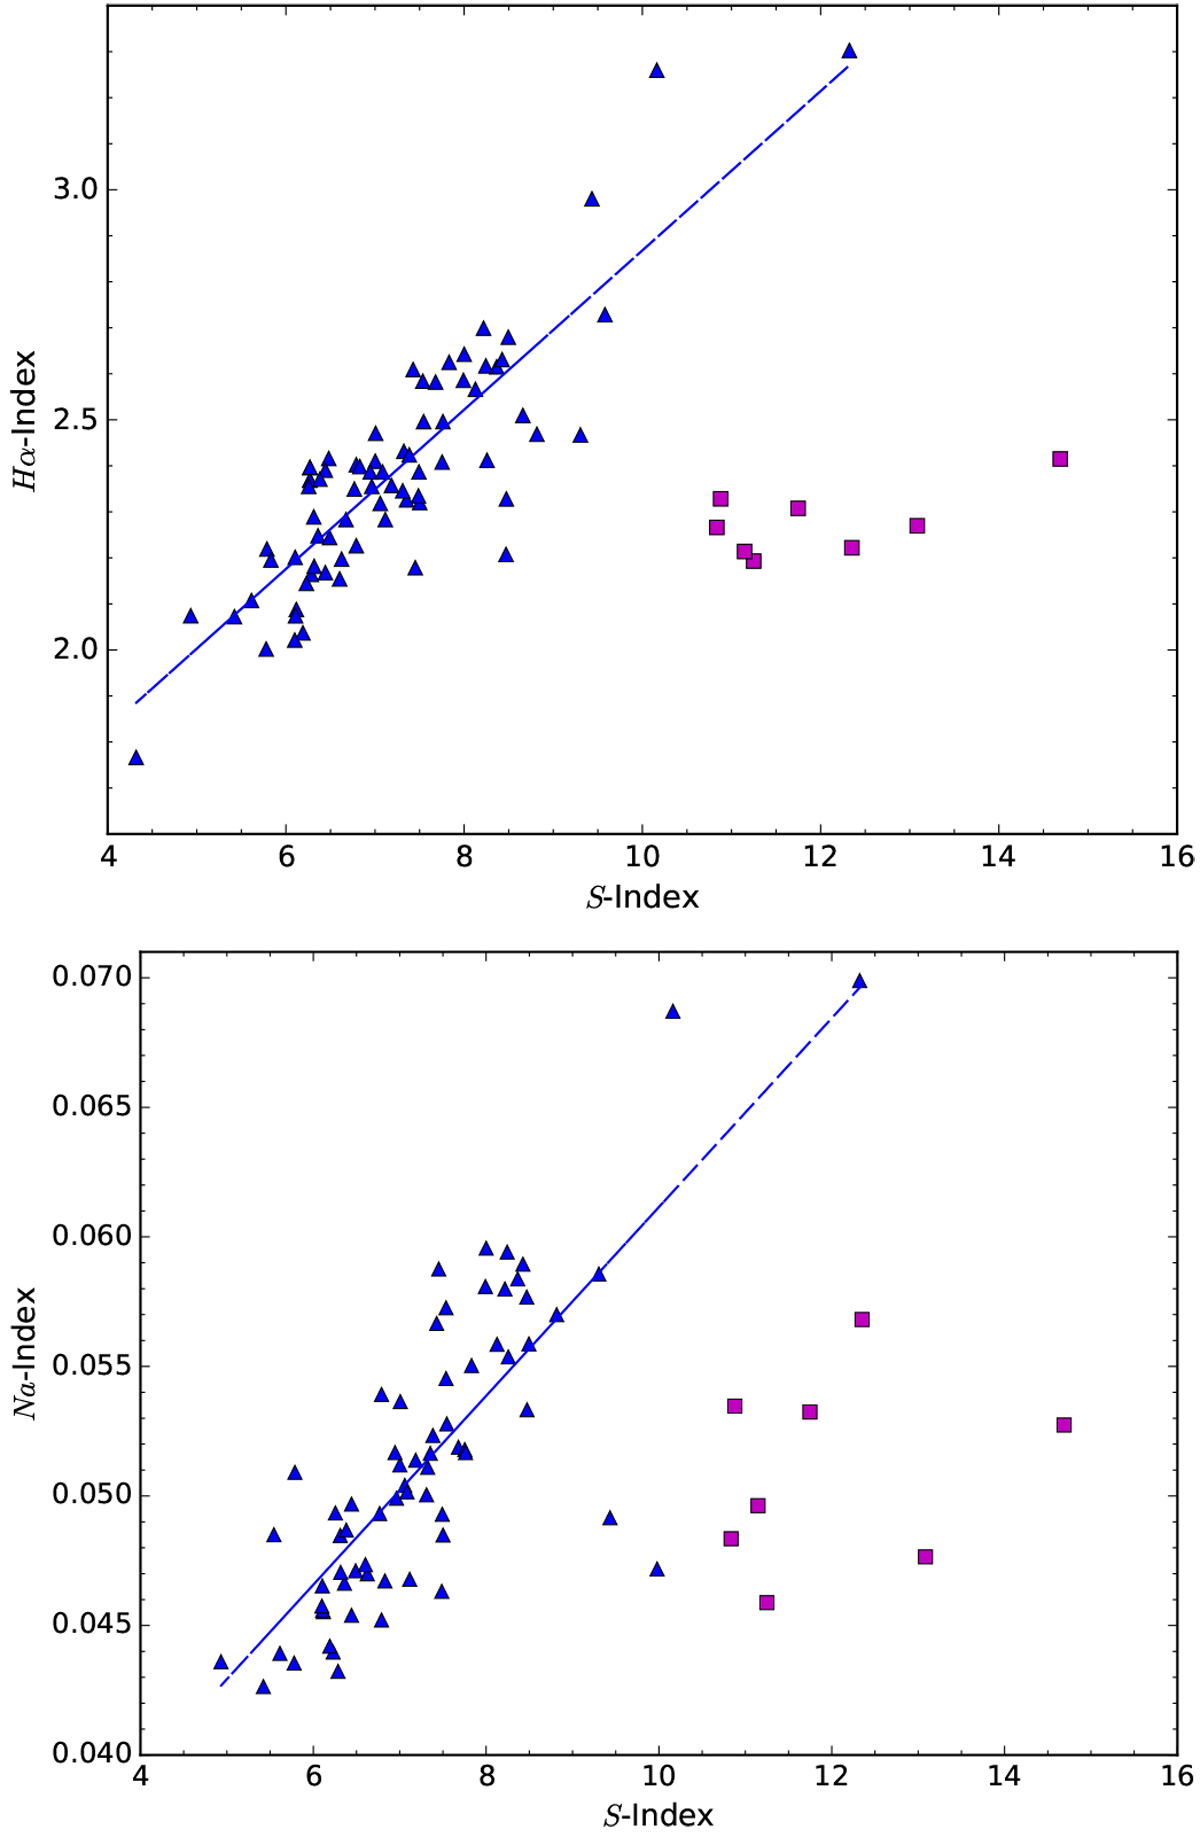
Simultaneous measurements of the Hα (top) and the Na I(bottom) indexes versus the Mount Wilson S-index for spectra that include the two features. The magenta squares indicate the points at which the magnetic activity level increased, some of them associated with flares (gray circles in Fig. 8).
Current usage metrics show cumulative count of Article Views (full-text article views including HTML views, PDF and ePub downloads, according to the available data) and Abstracts Views on Vision4Press platform.
Data correspond to usage on the plateform after 2015. The current usage metrics is available 48-96 hours after online publication and is updated daily on week days.
Initial download of the metrics may take a while.