Free Access
Fig. 13
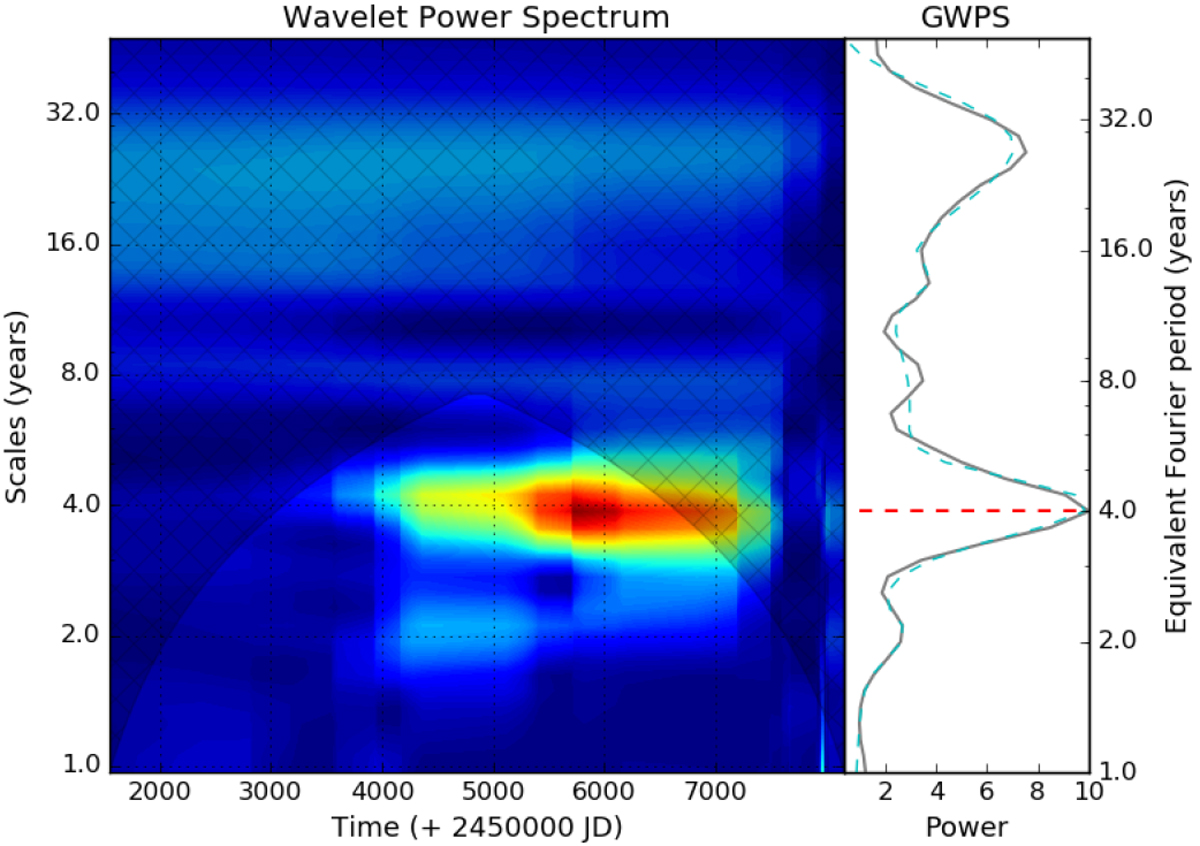
Contour wavelet plot for Gl 729, calculated using the S time series of Fig. 8. The GWPS is plotted to the right and is fit by a sum of Gaussians (dashed cyan line). The horizontal dashed red line in the GWPS represents the maximum peak.
Current usage metrics show cumulative count of Article Views (full-text article views including HTML views, PDF and ePub downloads, according to the available data) and Abstracts Views on Vision4Press platform.
Data correspond to usage on the plateform after 2015. The current usage metrics is available 48-96 hours after online publication and is updated daily on week days.
Initial download of the metrics may take a while.