Fig. 11
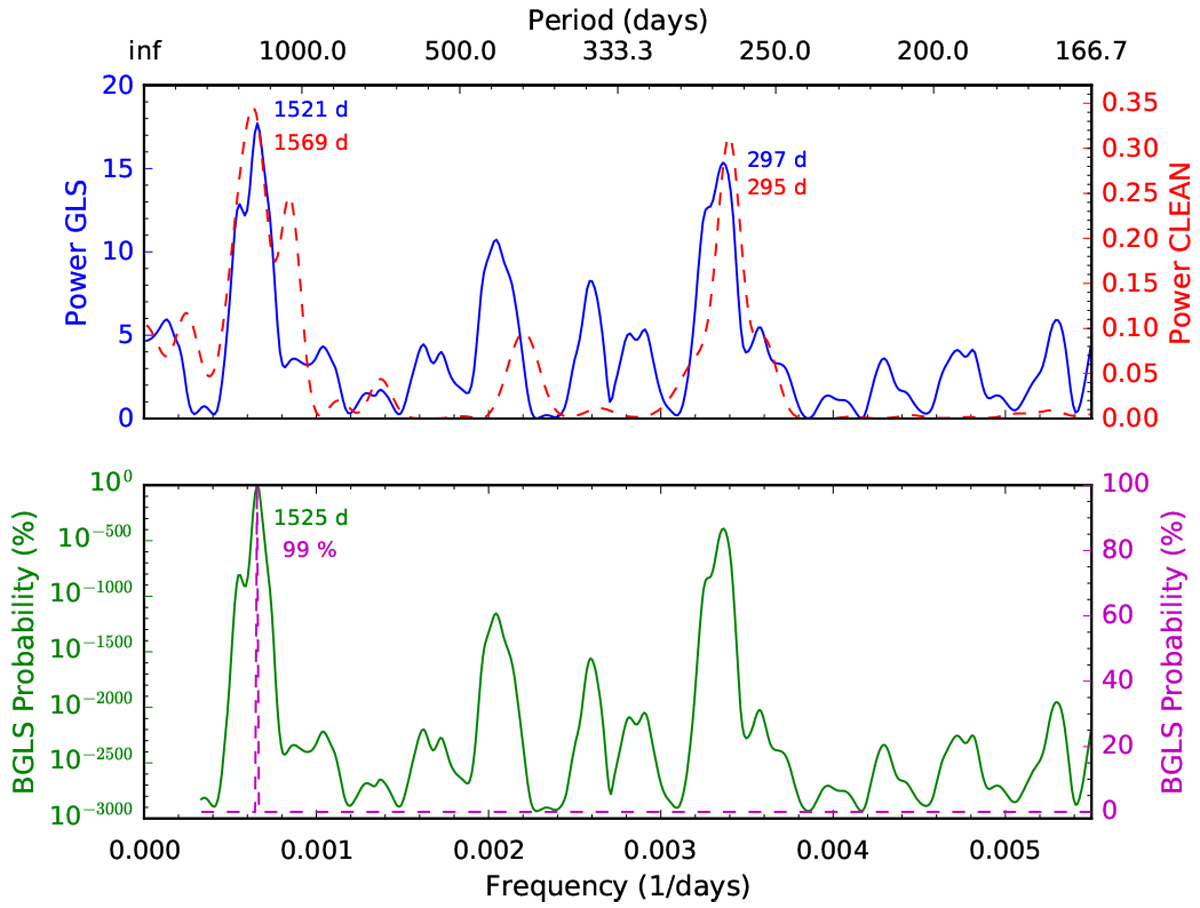
Top: GLS (solid blue line) and CLEAN (dashed red line) periodograms for the S time series of Gl 729. The most prominent peaks for the GLS periodogram with an FAP < 0.1% are (1521 ± 20) days and (297 ± 2) days. Bottom: Bayesian percentage probability indicates the 99% probability that the approximately 1500-day peak is the real activity cycle.
Current usage metrics show cumulative count of Article Views (full-text article views including HTML views, PDF and ePub downloads, according to the available data) and Abstracts Views on Vision4Press platform.
Data correspond to usage on the plateform after 2015. The current usage metrics is available 48-96 hours after online publication and is updated daily on week days.
Initial download of the metrics may take a while.