Fig. 8
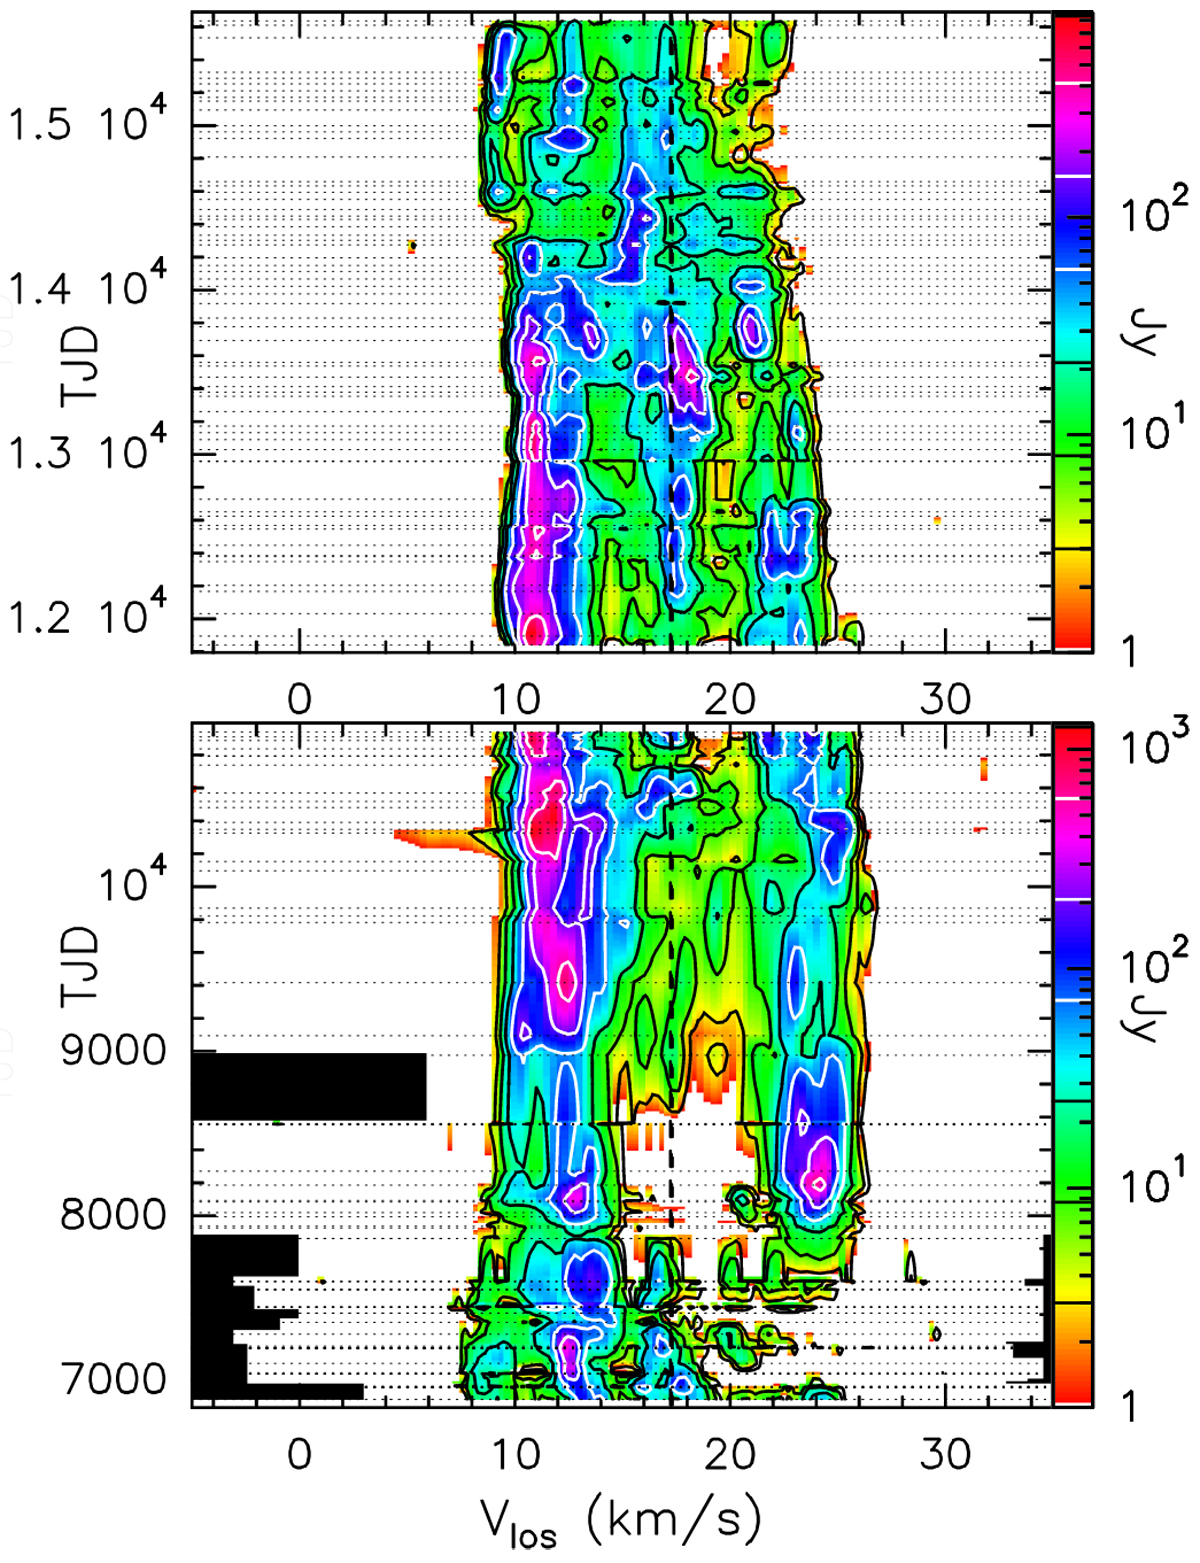
As in Fig. 2, but for RT Vir. Lower panel: first spectrum: 1/4/1987; JD = 2446886.5, TJD = 6886 and last spectrum 11/5/1998. Upper panel: first spectrum 27/10/2000 and last spectrum 20/3/2011. The black areas in the plot indicate the unobserved parts of the spectrum on those particular days. The low-level emission at Vlos ~ 4–10 km s−1 at TJD = 10329 is an artefact.
Current usage metrics show cumulative count of Article Views (full-text article views including HTML views, PDF and ePub downloads, according to the available data) and Abstracts Views on Vision4Press platform.
Data correspond to usage on the plateform after 2015. The current usage metrics is available 48-96 hours after online publication and is updated daily on week days.
Initial download of the metrics may take a while.