Fig. 6
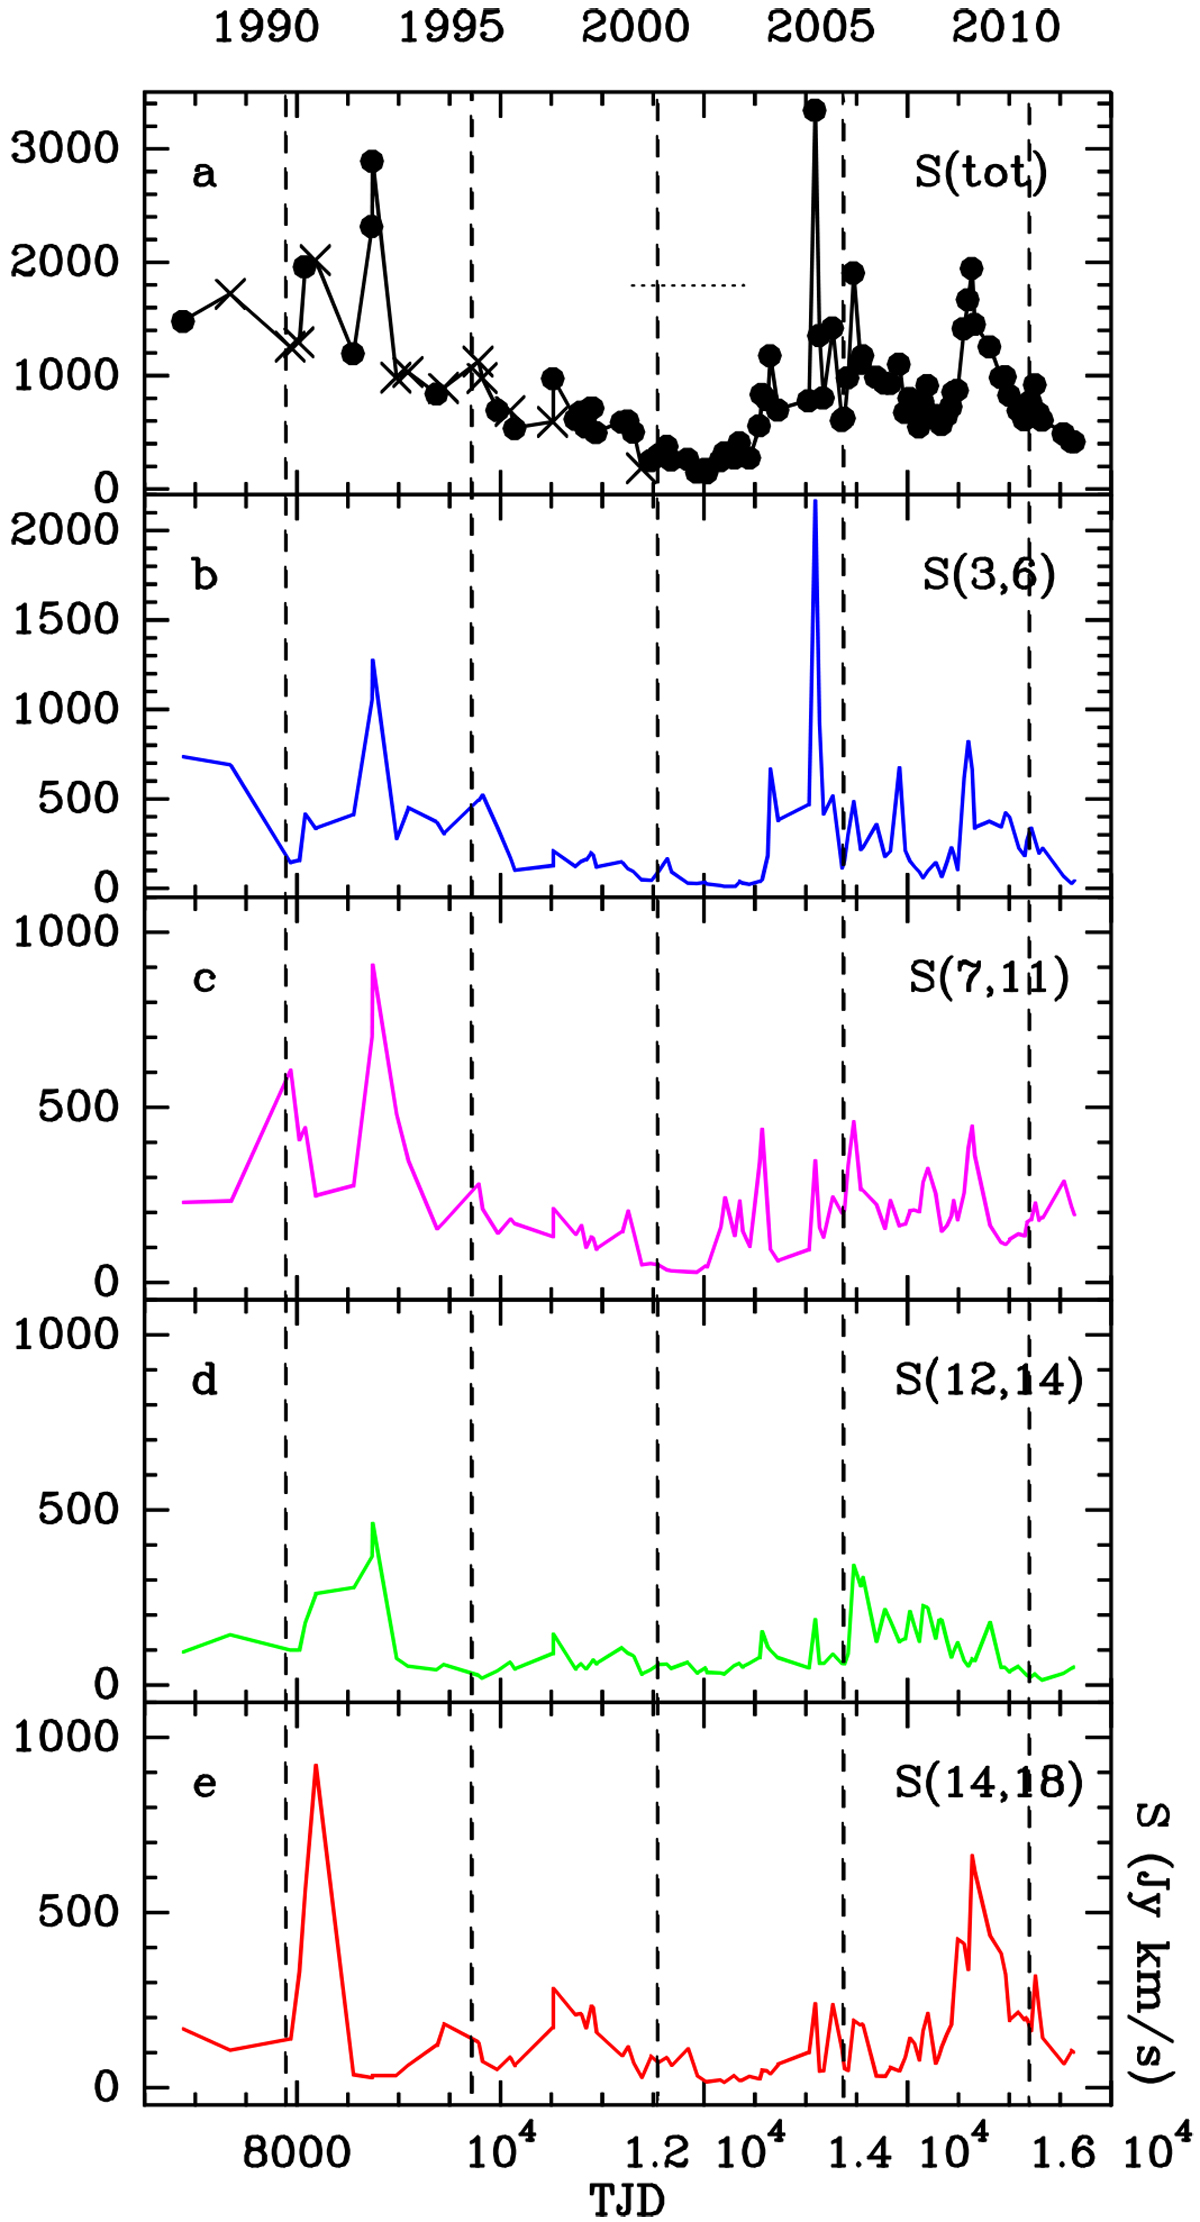
H2O maser light curves of R Crt in 1987–2011, showing the integrated flux density, S, in different velocity intervals versus TJD (= Julian Date – 2440000.5). Spectra taken within three days were averaged before determining S. The vertical lines connect the first day of each of the years indicated at the top of the figure with the corresponding TJD on the lower axis. (a) S(tot) is the total flux of all maser emission, between 0 < Vlos < 22 km s−1. Observations marked with crosses are from Effelsberg, the dots mark data from Medicina. A phase of relatively weak maser activity in 5/1999–5/2002 is marked by a horizontal dotted line. (b− e) S is the integrated flux in the velocity intervals given in the individual panels.
Current usage metrics show cumulative count of Article Views (full-text article views including HTML views, PDF and ePub downloads, according to the available data) and Abstracts Views on Vision4Press platform.
Data correspond to usage on the plateform after 2015. The current usage metrics is available 48-96 hours after online publication and is updated daily on week days.
Initial download of the metrics may take a while.