Fig. 2
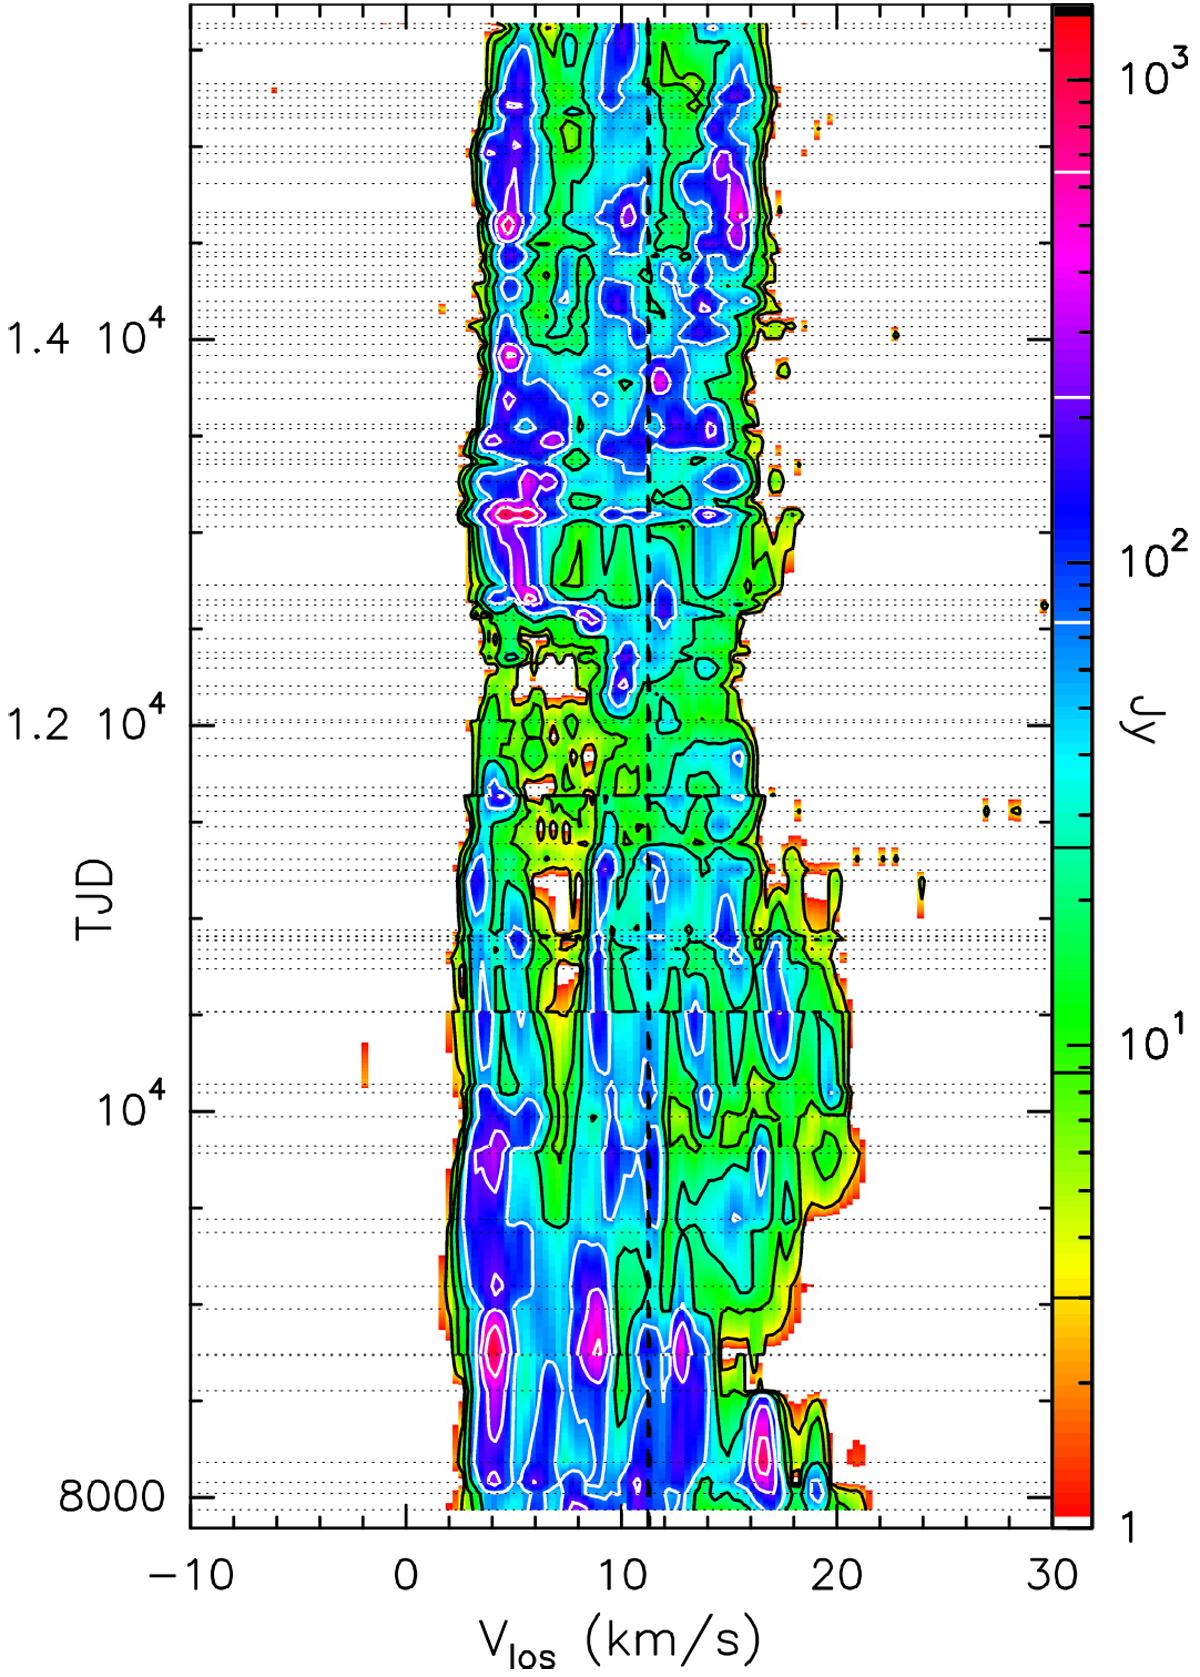
Flux density versus line-of-sight velocity, Vlos, as a function of time (FVt)-plot for R Crt. Each horizontal dotted line indicates an observation (spectra taken within 4 days from each other were averaged). Data are resampled to a resolution of 0.3 km s−1 and only emission at levels ≥3σ is shown. The first spectrum in this plot was taken on 17/2/90; JD = 2447939.5, TJD = 7939. The last spectrum is from 20/3/2011. The vertical dashed line marks the stellar velocity V* (Table 1). The flux density scale is shown by the bar on the right; the black and white horizontal lines mark the values of the drawn contours.
Current usage metrics show cumulative count of Article Views (full-text article views including HTML views, PDF and ePub downloads, according to the available data) and Abstracts Views on Vision4Press platform.
Data correspond to usage on the plateform after 2015. The current usage metrics is available 48-96 hours after online publication and is updated daily on week days.
Initial download of the metrics may take a while.