Fig. 6
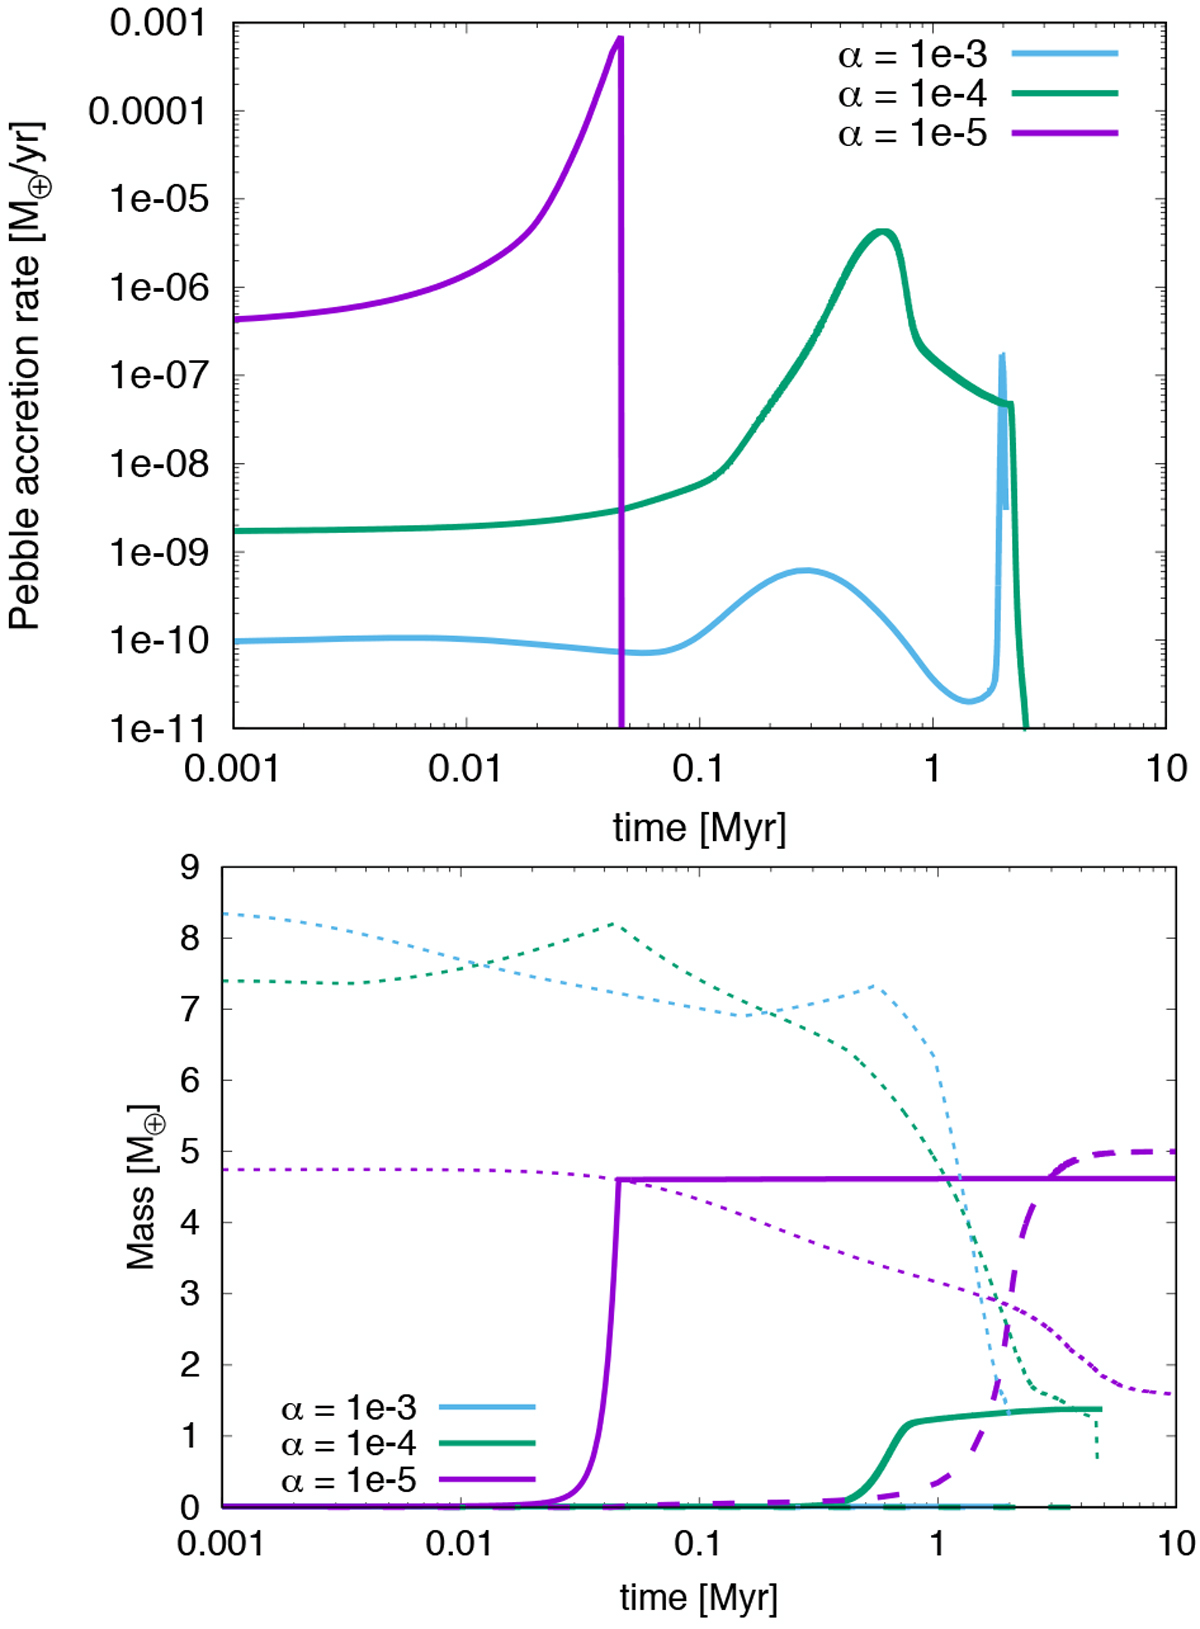
Evolution of the pebble accretion rate (top) and planet growth (bottom) for the same cases as in Fig. 5 (disc of Md,0 = 0.06 M⊙ of the nominal setup). Bottom panel: the solid lines show the growth of the core, the dashed lines the growth of the envelope, and the dotted thin lines the evolution of the pebble isolation mass foreach case. The accretion rate of pebbles is shut down very early for the case of α = 10−5 because Miso is attained.
Current usage metrics show cumulative count of Article Views (full-text article views including HTML views, PDF and ePub downloads, according to the available data) and Abstracts Views on Vision4Press platform.
Data correspond to usage on the plateform after 2015. The current usage metrics is available 48-96 hours after online publication and is updated daily on week days.
Initial download of the metrics may take a while.