Fig. 11
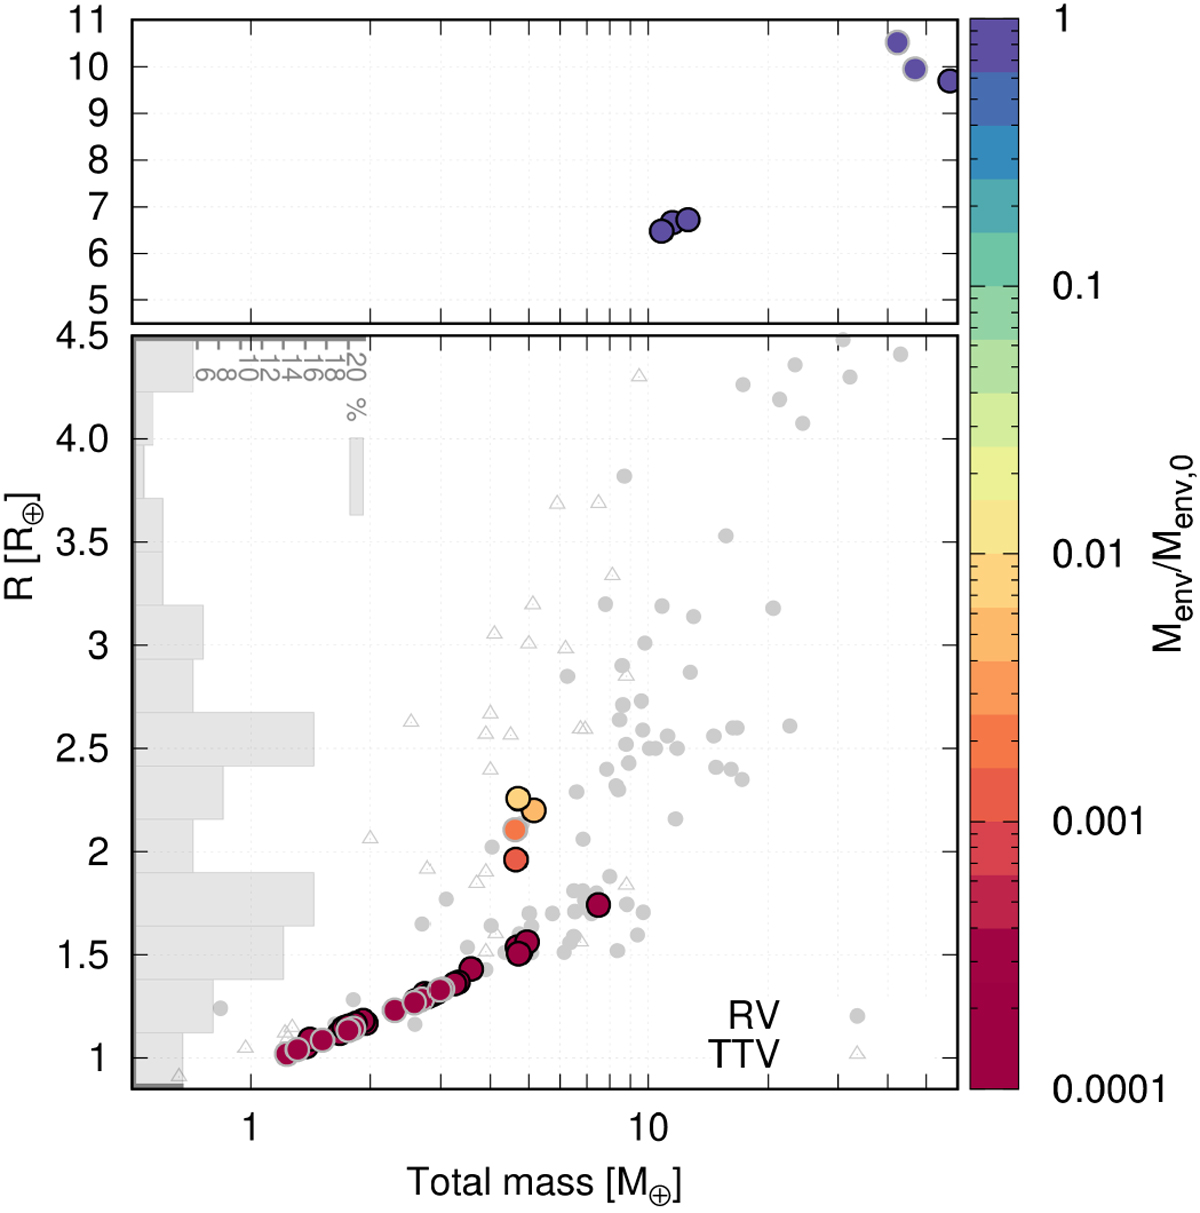
Final mass vs. radius for all the planets with P < 100 days and Mcore ≥ 1 M⊕, represented by coloured circles outlined in black. The coloured circles outlined in grey represent the planets computed with low dust opacity (Sect. 4.2). The colours show the final envelope mass relative to the initial one. The final masses of the envelopes and radii are computed as in Sect. 2.7. The grey small dots/triangles represent the RV/TTV planets used by Zeng et al. (2019; from their Fig. 2 and Table S1) and were used to construct the grey histogram on the left, which depicts the percentage of planets as a function of their radius.
Current usage metrics show cumulative count of Article Views (full-text article views including HTML views, PDF and ePub downloads, according to the available data) and Abstracts Views on Vision4Press platform.
Data correspond to usage on the plateform after 2015. The current usage metrics is available 48-96 hours after online publication and is updated daily on week days.
Initial download of the metrics may take a while.