Fig. 10
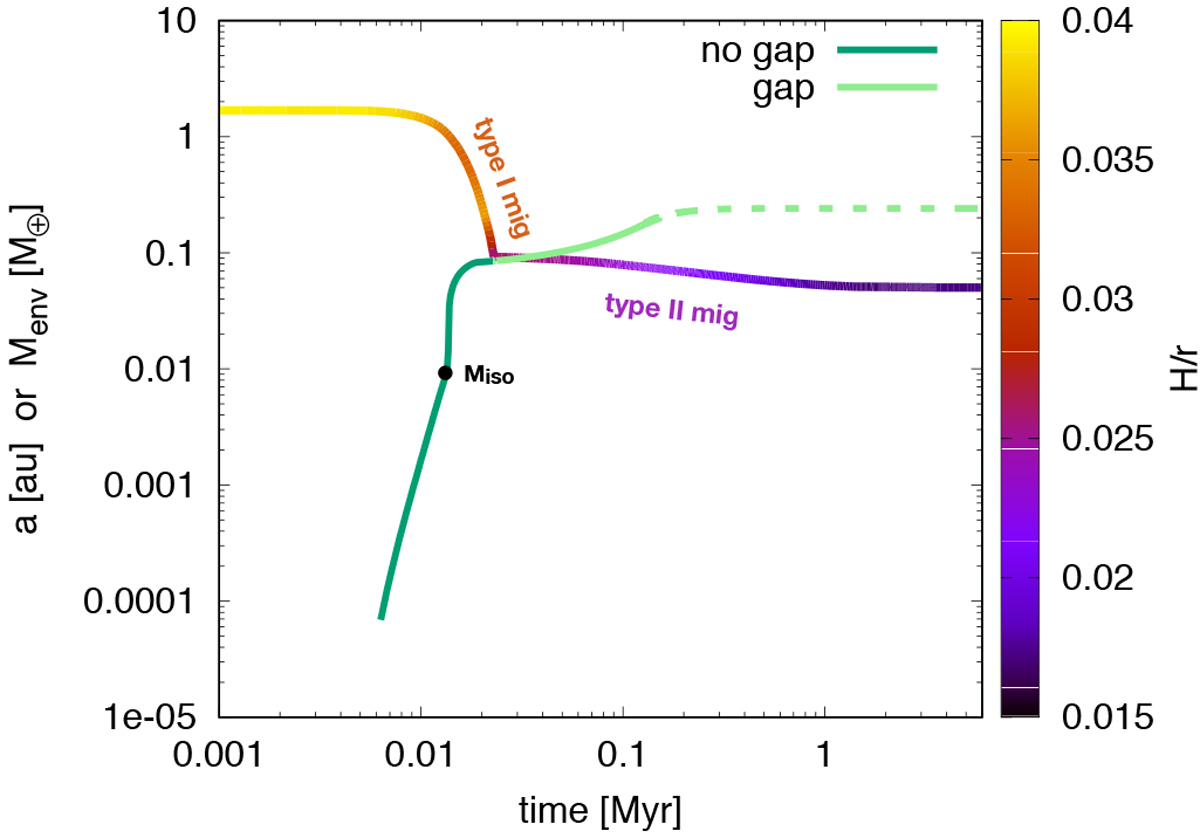
Evolution of semi-major axis (yellow-purple) and envelope mass (green curve) for the migrating case of Fig. 9. The point in time when the isolation mass is reached is marked with a black dot. The planet transitions from type I to type II migration when the gap opens (light green curve). The dashed curves indicate that gas accretion follows Tanigawa & Ikoma (2007).
Current usage metrics show cumulative count of Article Views (full-text article views including HTML views, PDF and ePub downloads, according to the available data) and Abstracts Views on Vision4Press platform.
Data correspond to usage on the plateform after 2015. The current usage metrics is available 48-96 hours after online publication and is updated daily on week days.
Initial download of the metrics may take a while.