Free Access
Fig. 7.
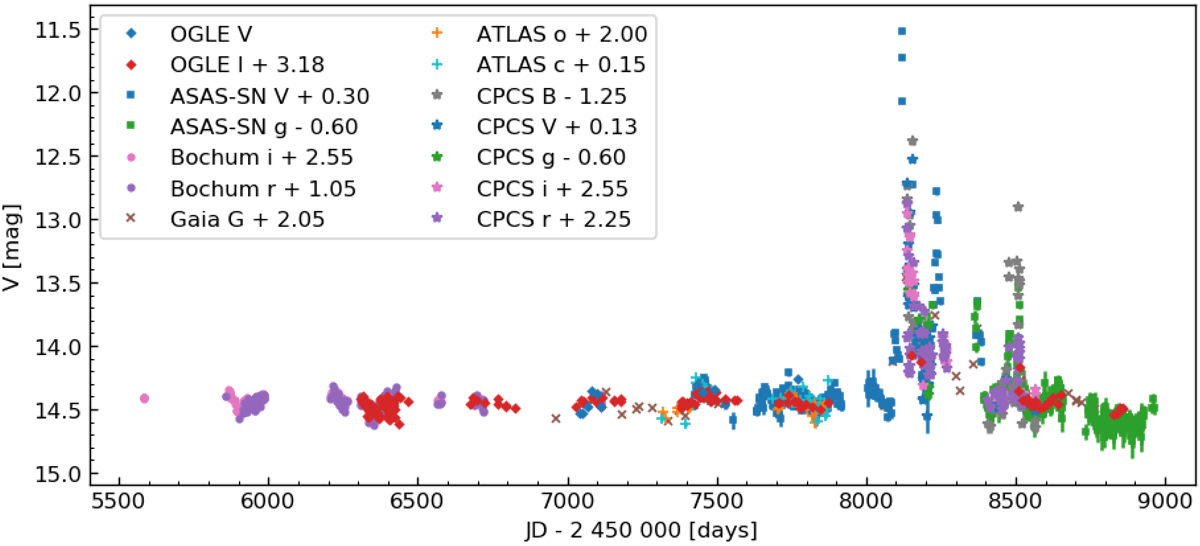
Light curves of Gaia18aen. Individual light curves in various filters were shifted to the level in the OGLE V filter for clarity; values of shifts are shown in the figure legend. Different colors denote different filters.
Current usage metrics show cumulative count of Article Views (full-text article views including HTML views, PDF and ePub downloads, according to the available data) and Abstracts Views on Vision4Press platform.
Data correspond to usage on the plateform after 2015. The current usage metrics is available 48-96 hours after online publication and is updated daily on week days.
Initial download of the metrics may take a while.