Fig. 10.
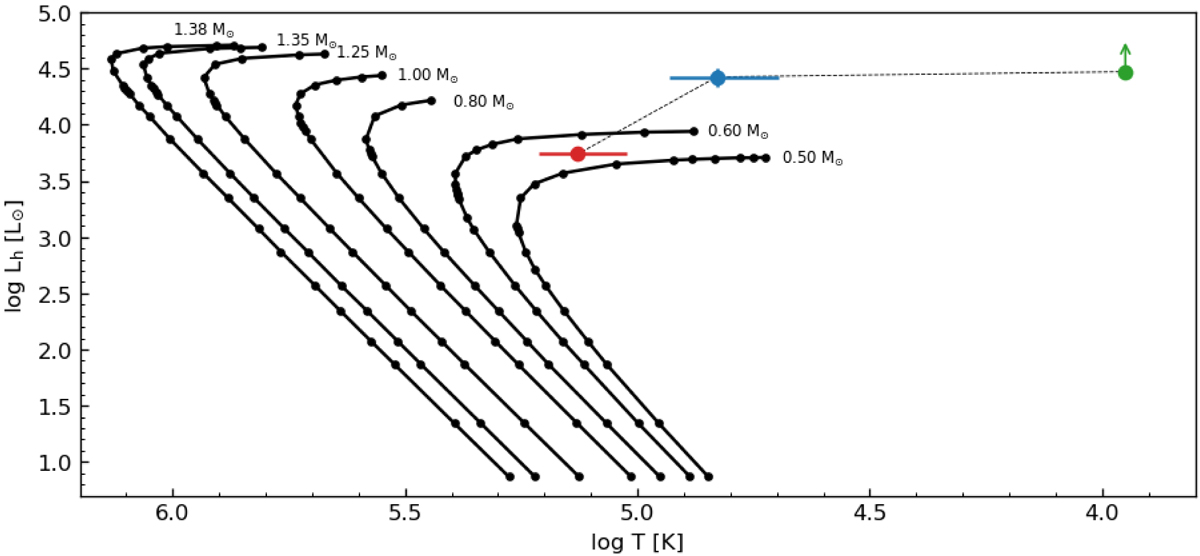
Evolution of the hot component of Gaia18aen in the HR diagram throughout its outburst. The green symbol corresponds to the optical maximum; the blue and orange symbols represent the values calculated using the datasets obtained 20 and 81 d after the outburst maximum, respectively. The dotted solid curves are steady models of Nomoto et al. (2007).
Current usage metrics show cumulative count of Article Views (full-text article views including HTML views, PDF and ePub downloads, according to the available data) and Abstracts Views on Vision4Press platform.
Data correspond to usage on the plateform after 2015. The current usage metrics is available 48-96 hours after online publication and is updated daily on week days.
Initial download of the metrics may take a while.