Fig. 7.
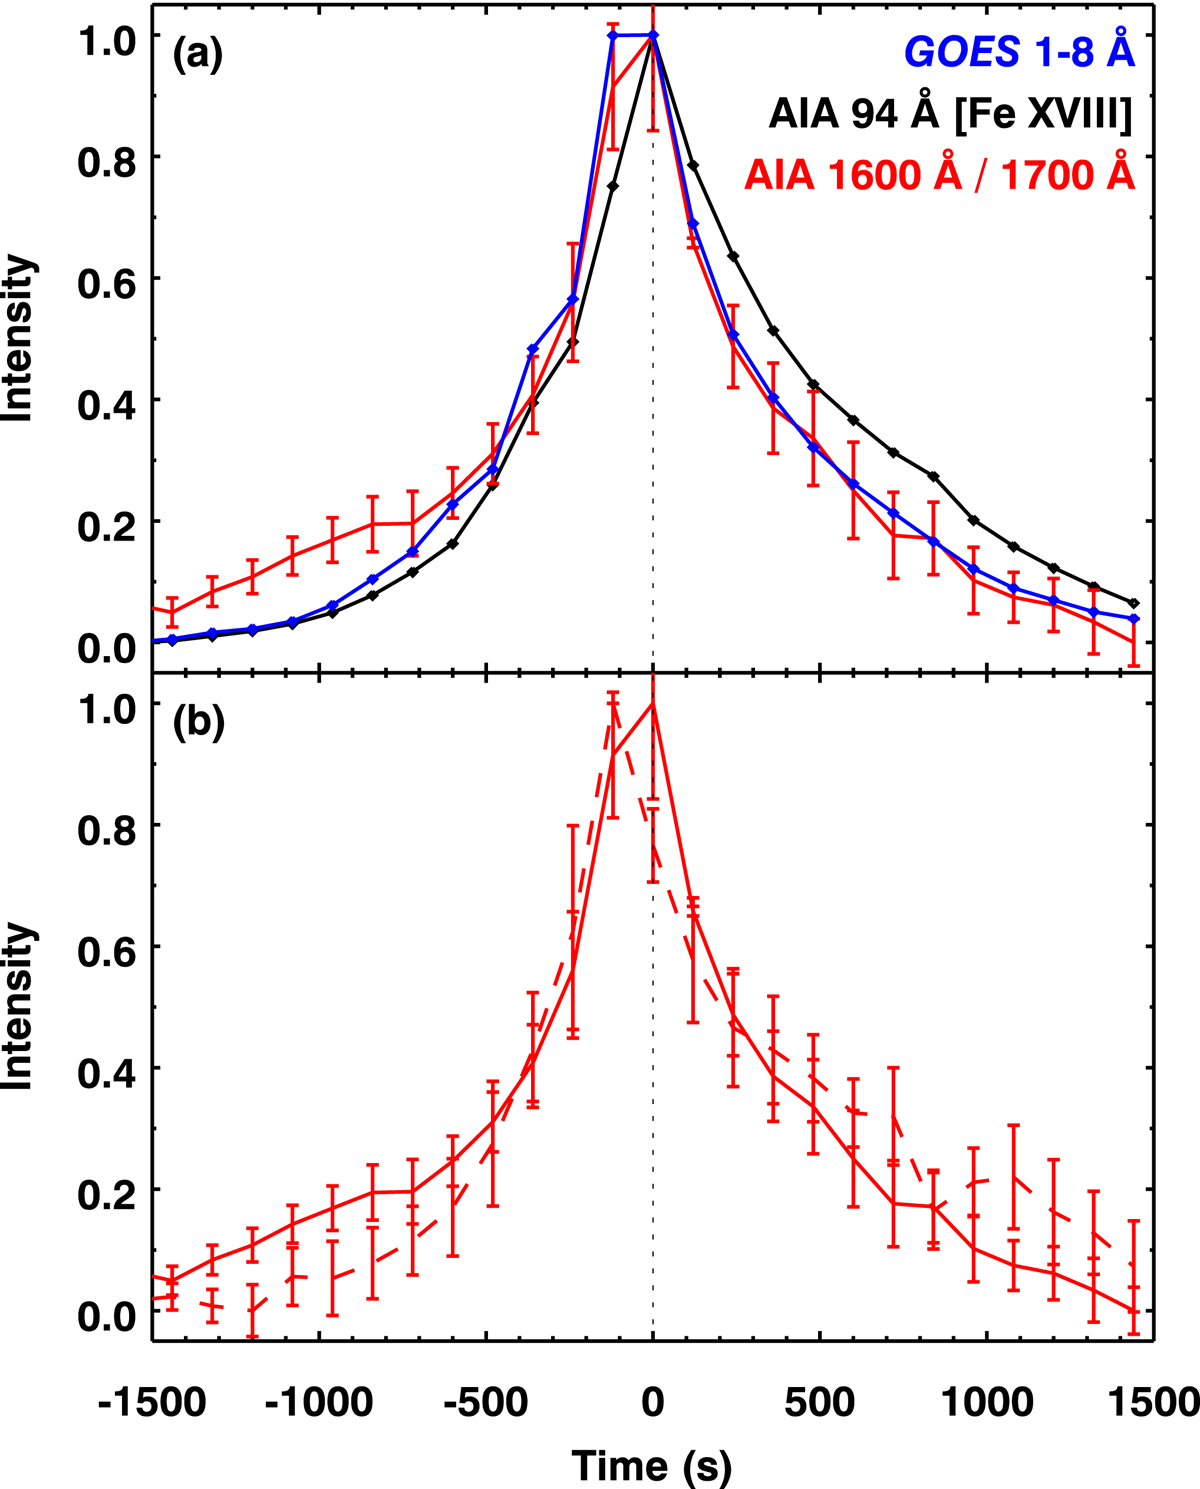
Statistical overview of impulsive heating events observed in the cores of seven different ARs. An integrated light curve derived from all the impulsive heating events associated with mixed magnetic polarities at the loop footpoints is displayed in panel a. The disk integrated GOES 1−8 Å X-ray flux, core integrated Fe XVIII emission and the corresponding UV ratio signal from contoured patches, in bins of 120 s (i.e. the considered cadence of AIA EUV observations) as a function of time are shown. Here the elapsed time is in seconds with respect to the time of Fe XVIII peak. The respective error bars associated with the UV ratio signal represent 1-σ standard deviation at a given bin, derived from 1000 realisations of light curves, each produced by a blind integration of random number of individual light curves. Panel b: UV ratio signal from the mixed cases (solid curve; the same as in the top panel) is compared with its counterpart from the unipolar cases (dashed curve). See Sect. 4.2 for discussion.
Current usage metrics show cumulative count of Article Views (full-text article views including HTML views, PDF and ePub downloads, according to the available data) and Abstracts Views on Vision4Press platform.
Data correspond to usage on the plateform after 2015. The current usage metrics is available 48-96 hours after online publication and is updated daily on week days.
Initial download of the metrics may take a while.