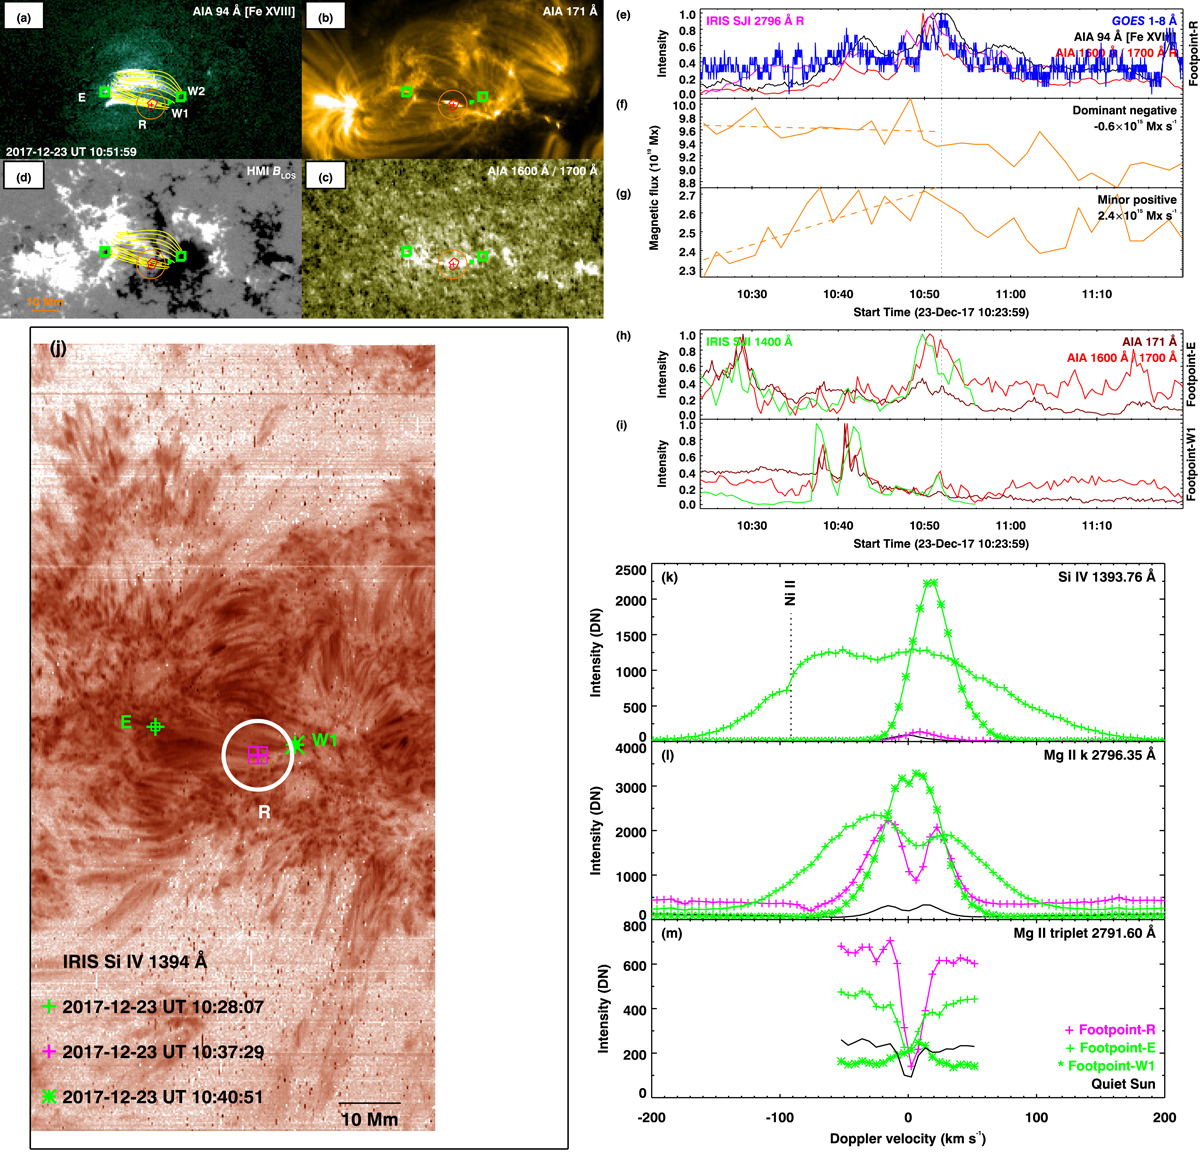
Fig. 4.
Impulsive heating in the core of AR 12692. Panels a–g: similar to their counterparts in Fig. 2. Panels h and i: time series of light curves from footpoint regions E and W1 (marked in panel a). Panel j: an IRIS Si IV 1394 Å raster map in an inverted colour scheme. The overlaid circle is roughly at the same location as in panels a–d. Footpoint regions E-R-W1 are marked. A 10 Mm scale is overlaid. The IRIS SJI 2796 Å light curve from footpoint-R (magenta box) is displayed in panel e. SJI 1400 Å light curves from footpoints E and W1 (green boxes in panel j) are shown in panels h and i. Panels k–m: Si IV, Mg II k, and Mg II triplet spectral profiles (footpoint-R in magenta-plus; footpoint-E in green-plus; footpoint-W in green-asterisk; average quiet Sun profiles in black; in panel k the quiet Sun profile is multiplied by ten and the dotted line identifies a Ni II absorption profile). The timestamps of the spectral profiles in UT are given in panel j. AIA data are plotted at their native cadence (EUV at 12 s and UV at 24 s). Animation of panels a–g is available online. See Sects. 2, 3.2 and Appendix A for details.
Current usage metrics show cumulative count of Article Views (full-text article views including HTML views, PDF and ePub downloads, according to the available data) and Abstracts Views on Vision4Press platform.
Data correspond to usage on the plateform after 2015. The current usage metrics is available 48-96 hours after online publication and is updated daily on week days.
Initial download of the metrics may take a while.