Fig. 2.
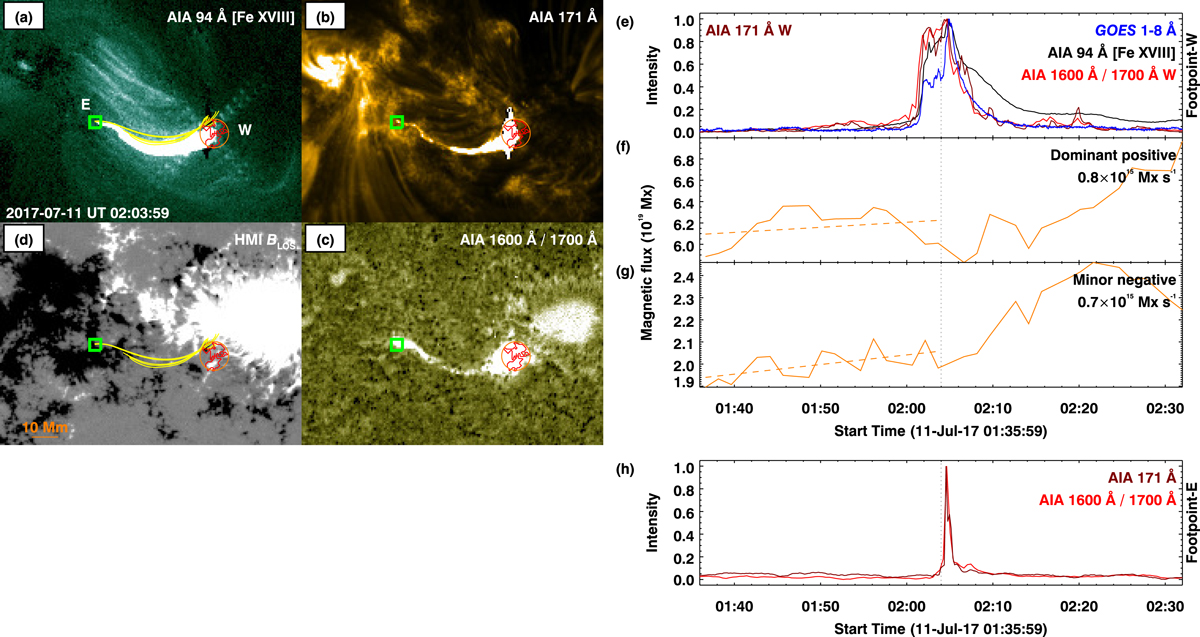
Impulsive heating in the core of AR 12665. Panels a–d: snapshots of various observables in the core close to the peak in Fe XVIII intensity (see Fig. 1). Maps of AIA 94 Å Fe XVIII (panel a), AIA 171 Å (panel b), ratio of AIA 1600 Å to 1700 Å (UV ratio; panel c), and with a grey-scale an HMI line-of-sight magnetic field map (panel d) are displayed. The magnetic flux density is saturated at ±300 G. White (dark) shaded regions represent positive (negative) magnetic polarity. Panel a: E and W label eastern and western footpoints of the loop. The red contour outlines a contiguous patch in the UV ratio map detected by our method. The plus symbol marks the centroid of the contoured region. The circle with radius ≈5.4 Mm, about the centroid, outlines the region used for magnetic analysis. A 10 Mm scale is overlaid. Panels a and d: yellow coloured curves represent magnetic field lines traced from a linear force free field extrapolation. Panels e–g: time series of various observables. Panel e: disk-integrated GOES 1−8 Å X-ray flux (blue), Fe XVIII emission integrated over the AR’s core (black), UV ratio (red) and AIA 171 Å (maroon) emission integrated over the contoured region at the western footpoint. Panels f and g: integrated magnetic flux as a function of time of the dominant (positive) and minor (negative) magnetic polarities within the circled region overlaid on panel d. The dashed line is a linear fit to the magnetic flux curve, with its slope quoted in the top right corner. Panel h: UV ratio and AIA 171 Å emission from the eastern (E) footpoint regions marked in panel a. The vertical dotted line in panels e–h marks the peak of Fe XVIII as identified in the 120 s cadence data. For display purposes, in panels e and h we plot AIA data at their native cadence (12 s EUV and 24 s UV). Animation of panels a–g is available online. See Sects. 2, 3.1 and Appendix A for details.
Current usage metrics show cumulative count of Article Views (full-text article views including HTML views, PDF and ePub downloads, according to the available data) and Abstracts Views on Vision4Press platform.
Data correspond to usage on the plateform after 2015. The current usage metrics is available 48-96 hours after online publication and is updated daily on week days.
Initial download of the metrics may take a while.