Fig. B.9.
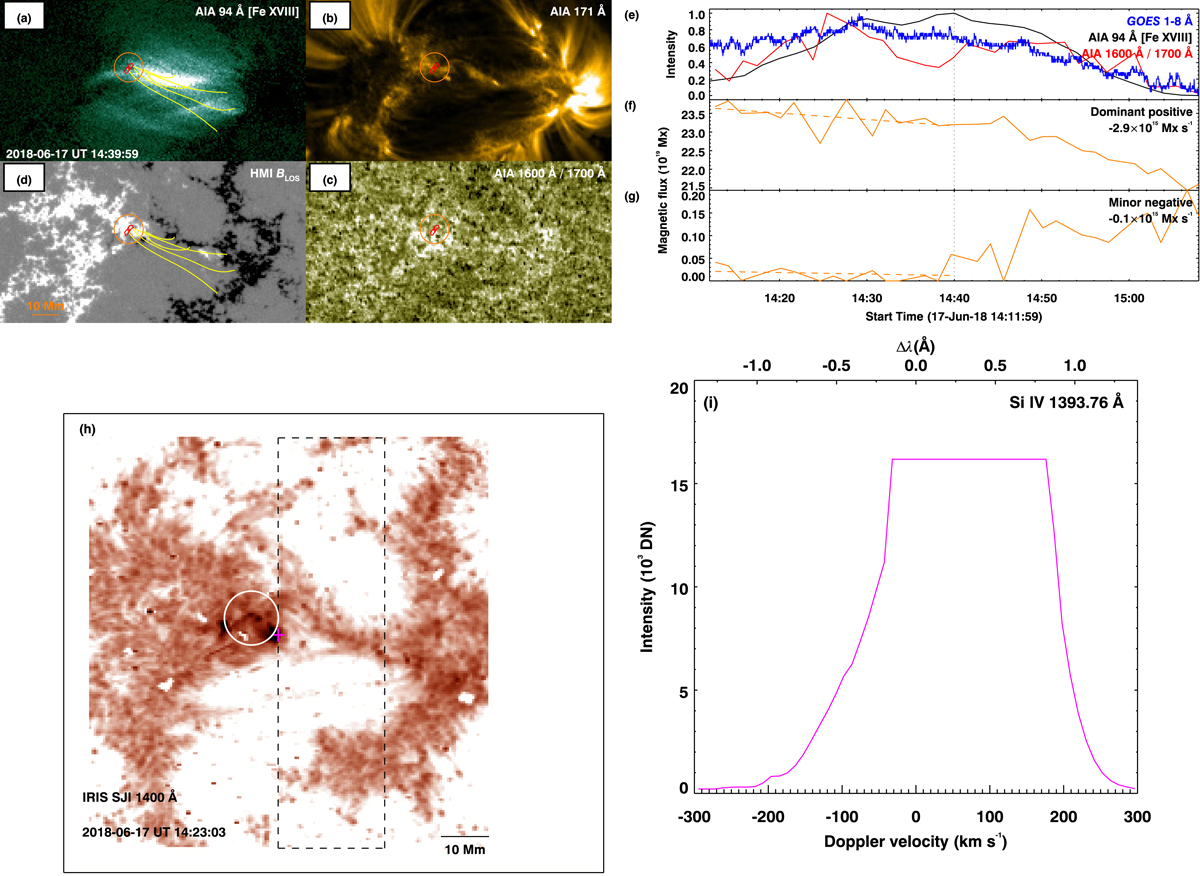
Impulsive heating in the core of AR 12713. The format is the same as in Fig. B.6. Bottom left panel: IRIS SJI 1400 Å map in an inverted grey scale. The dashed region outlines the spatial extent of raster observations in this case. The circular region from the top panels is overlaid. The magenta plus symbol marks a feature at the edge of the circle. Lower right panel: Si IV 1394 Å spectral profile at the location of plus symbol. The profile is saturated due mainly to the 60 s long exposure time used in this observation. AIA light curves are shown at lower cadence. Animation of panels a–g is available online.
Current usage metrics show cumulative count of Article Views (full-text article views including HTML views, PDF and ePub downloads, according to the available data) and Abstracts Views on Vision4Press platform.
Data correspond to usage on the plateform after 2015. The current usage metrics is available 48-96 hours after online publication and is updated daily on week days.
Initial download of the metrics may take a while.