Fig. 1.
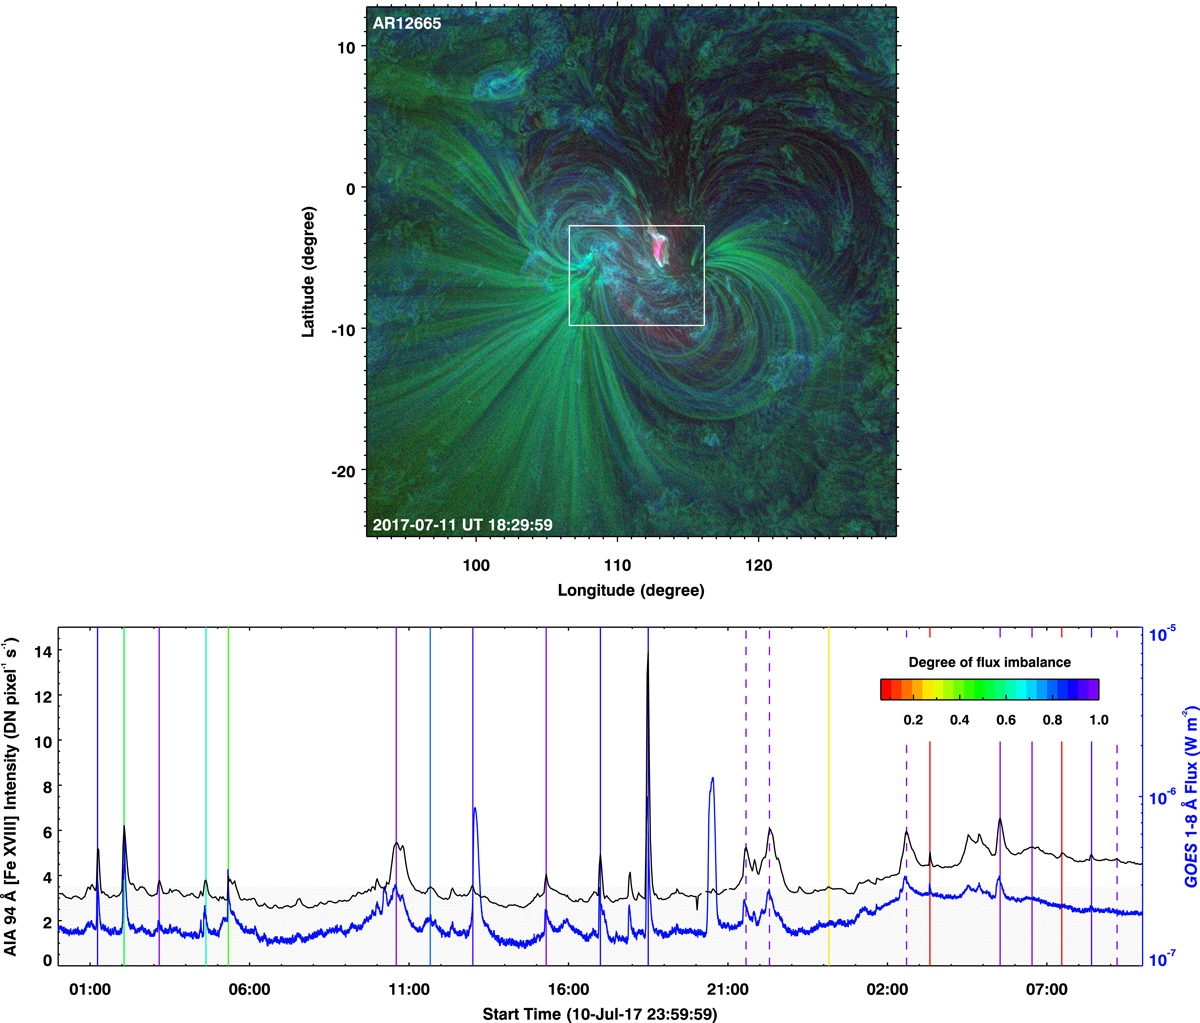
Overview of AR 12665 and impulsive heating events observed therein. Upper panel: three-channel composite map of the AR observed with SDO/AIA on 2017 July 11. The EUV emission recorded by three filters, AIA 171 Å (green), AIA 193 Å (blue), and AIA 94 Å Fe XVIII proxy (red), highlight various regions in the AR. The core of the AR is marked by a white rectangle. Lower panel: time series of core-integrated Fe XVIII EUV emission (black curve) for a period of 34 h. The blue curve represents the time series of solar disk integrated GOES 1−8 Å X-ray flux. Various vertical lines mark local peaks identified in the Fe XVIII light curve. Based on corresponding SDO/HMI observations, the solid vertical lines mark mixed polarity events (i.e. when at least one footpoint of the brightening loops had a mixed polarity), dashed lines identify unipolar events. These vertical lines are colour-coded with the degree of photospheric magnetic flux imbalance. Any Fe XVIII peak entirely within the grey shaded band is not considered in our analysis. See Sect. 2 and Appendix A for details.
Current usage metrics show cumulative count of Article Views (full-text article views including HTML views, PDF and ePub downloads, according to the available data) and Abstracts Views on Vision4Press platform.
Data correspond to usage on the plateform after 2015. The current usage metrics is available 48-96 hours after online publication and is updated daily on week days.
Initial download of the metrics may take a while.