Fig. 5.
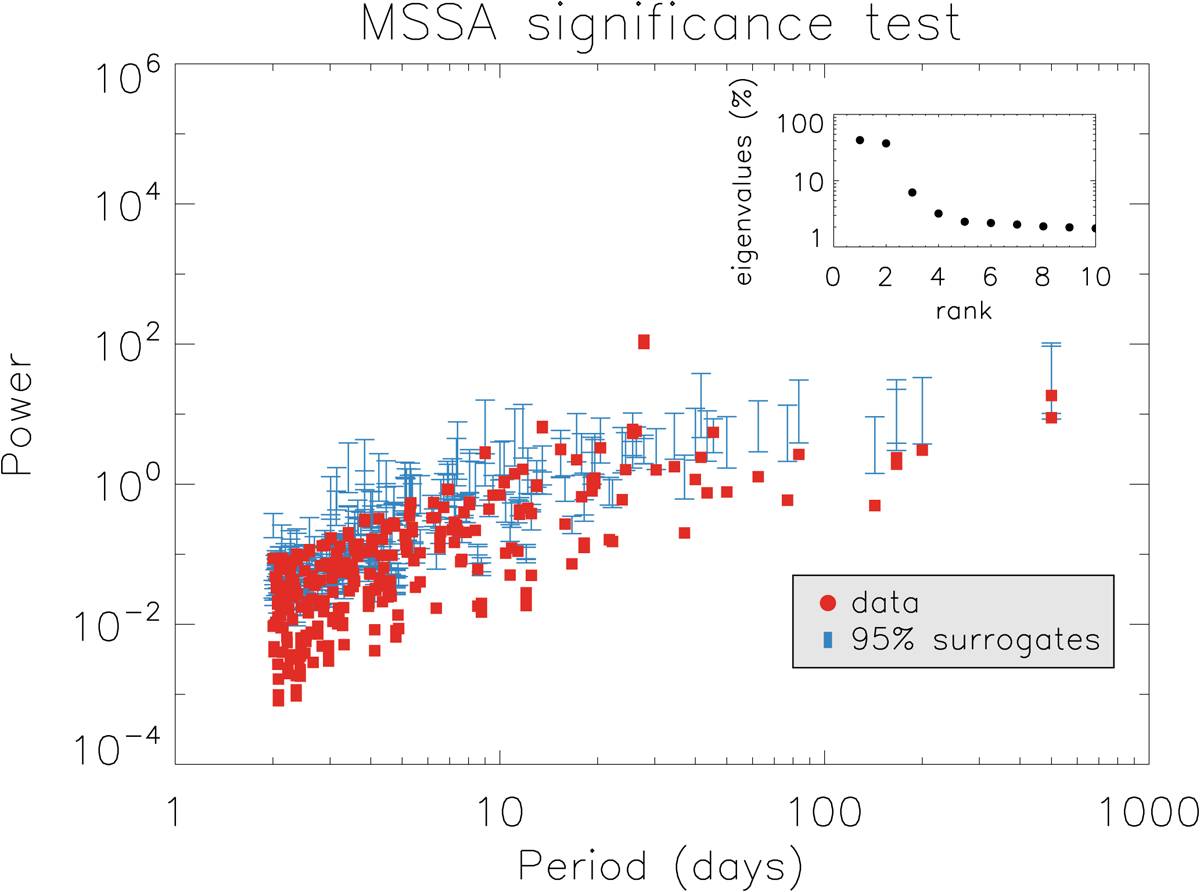
Monte Carlo MSSA test of the ten time series at a colatitude of 120°. The lag window length M is 60 days. The significant signals (at 5% significance level) are those whose data eigenvalues lie above the 97.5th percentiles of the surrogate eigenvalues: according to the test, these signals have more variance than would be expected from a noise process. Eigenvalues (shown in the inset) are normalized to represent the appropriate fraction in % of the total variance of the time series.
Current usage metrics show cumulative count of Article Views (full-text article views including HTML views, PDF and ePub downloads, according to the available data) and Abstracts Views on Vision4Press platform.
Data correspond to usage on the plateform after 2015. The current usage metrics is available 48-96 hours after online publication and is updated daily on week days.
Initial download of the metrics may take a while.