Fig. 8
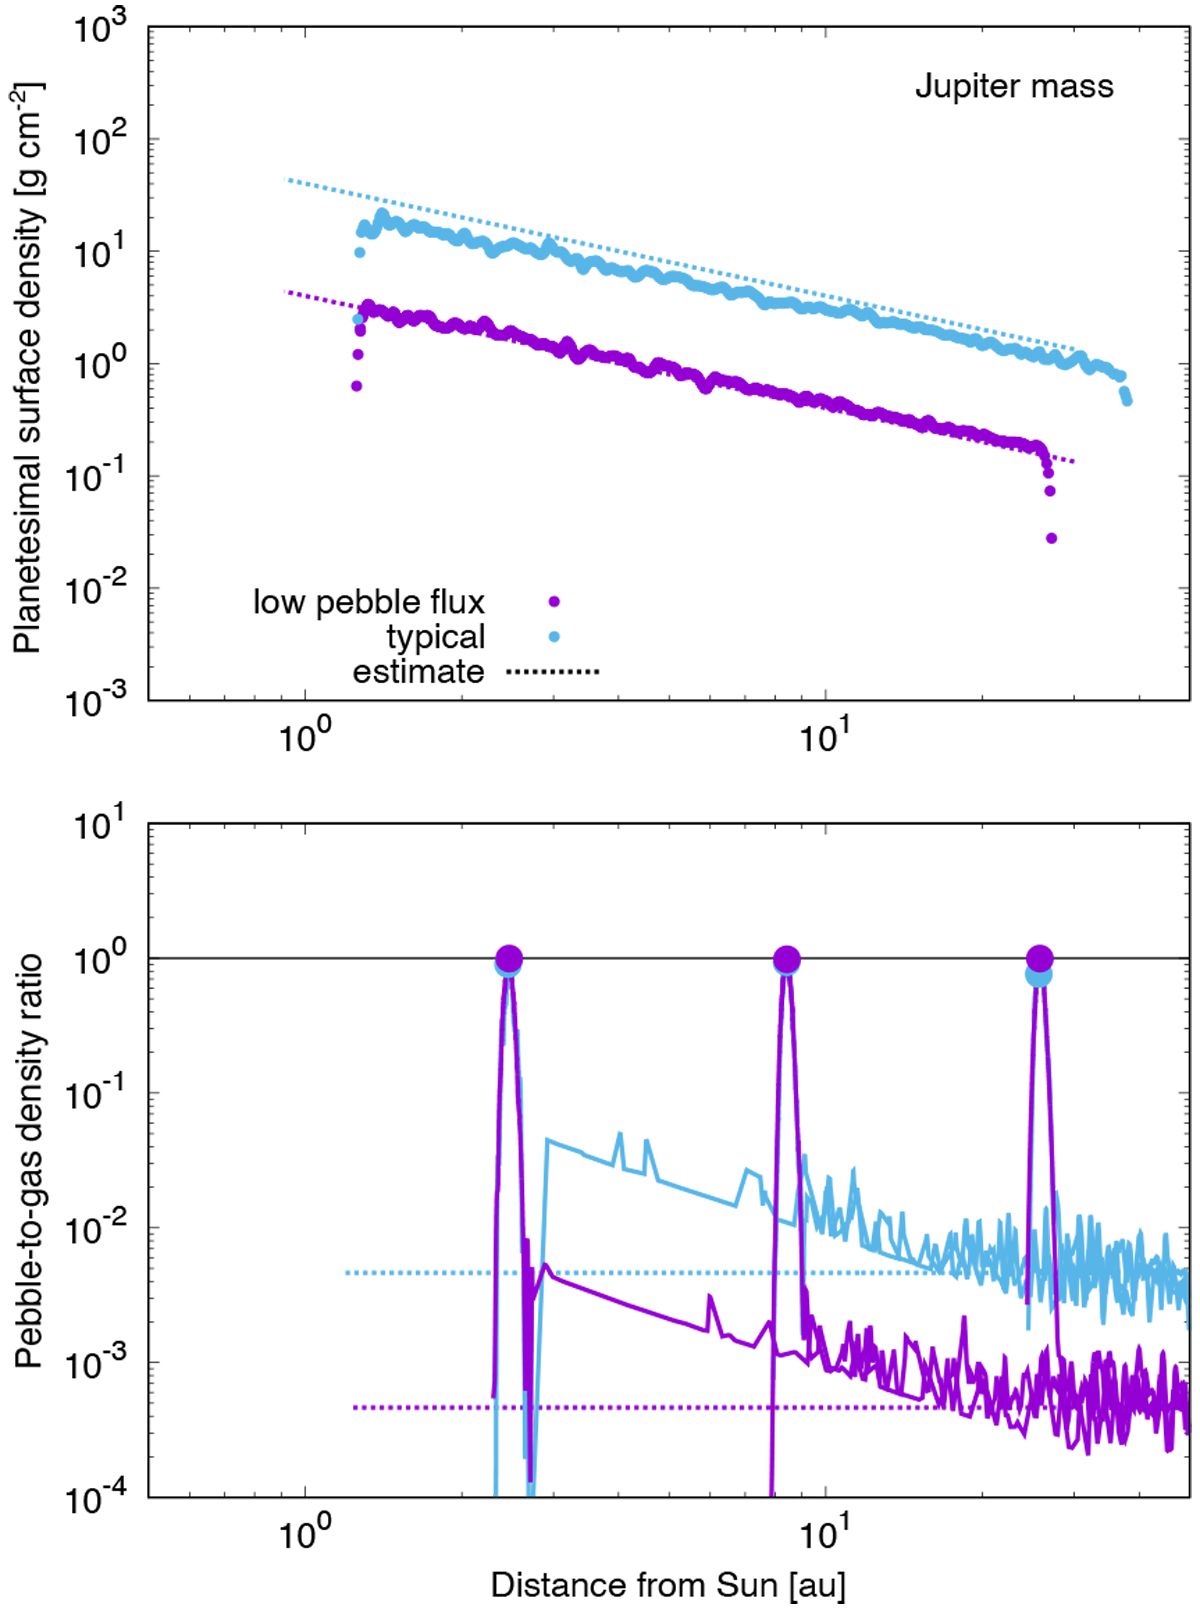
Same as Fig. 5 but with a Jupiter mass planet and its Type II migration. The purple and light blue plots represent the profiles with Ṁpeb = 10−5 and 10−4 ME yr−1 in Disc A, respectively. The rate to insert the super-particles of pebbles is 10 times lower and the duration of the time step is 10 times longerthan those of the normal cases to make the calculation time shorter. The calculations are stopped when the planets reach about 0.9 au. The time of the snapshots in the lower panel are t = 1.1 × 10⁶, 2.3 × 10⁶, and 2.7 × 10⁶ yr.
Current usage metrics show cumulative count of Article Views (full-text article views including HTML views, PDF and ePub downloads, according to the available data) and Abstracts Views on Vision4Press platform.
Data correspond to usage on the plateform after 2015. The current usage metrics is available 48-96 hours after online publication and is updated daily on week days.
Initial download of the metrics may take a while.