Fig. 5
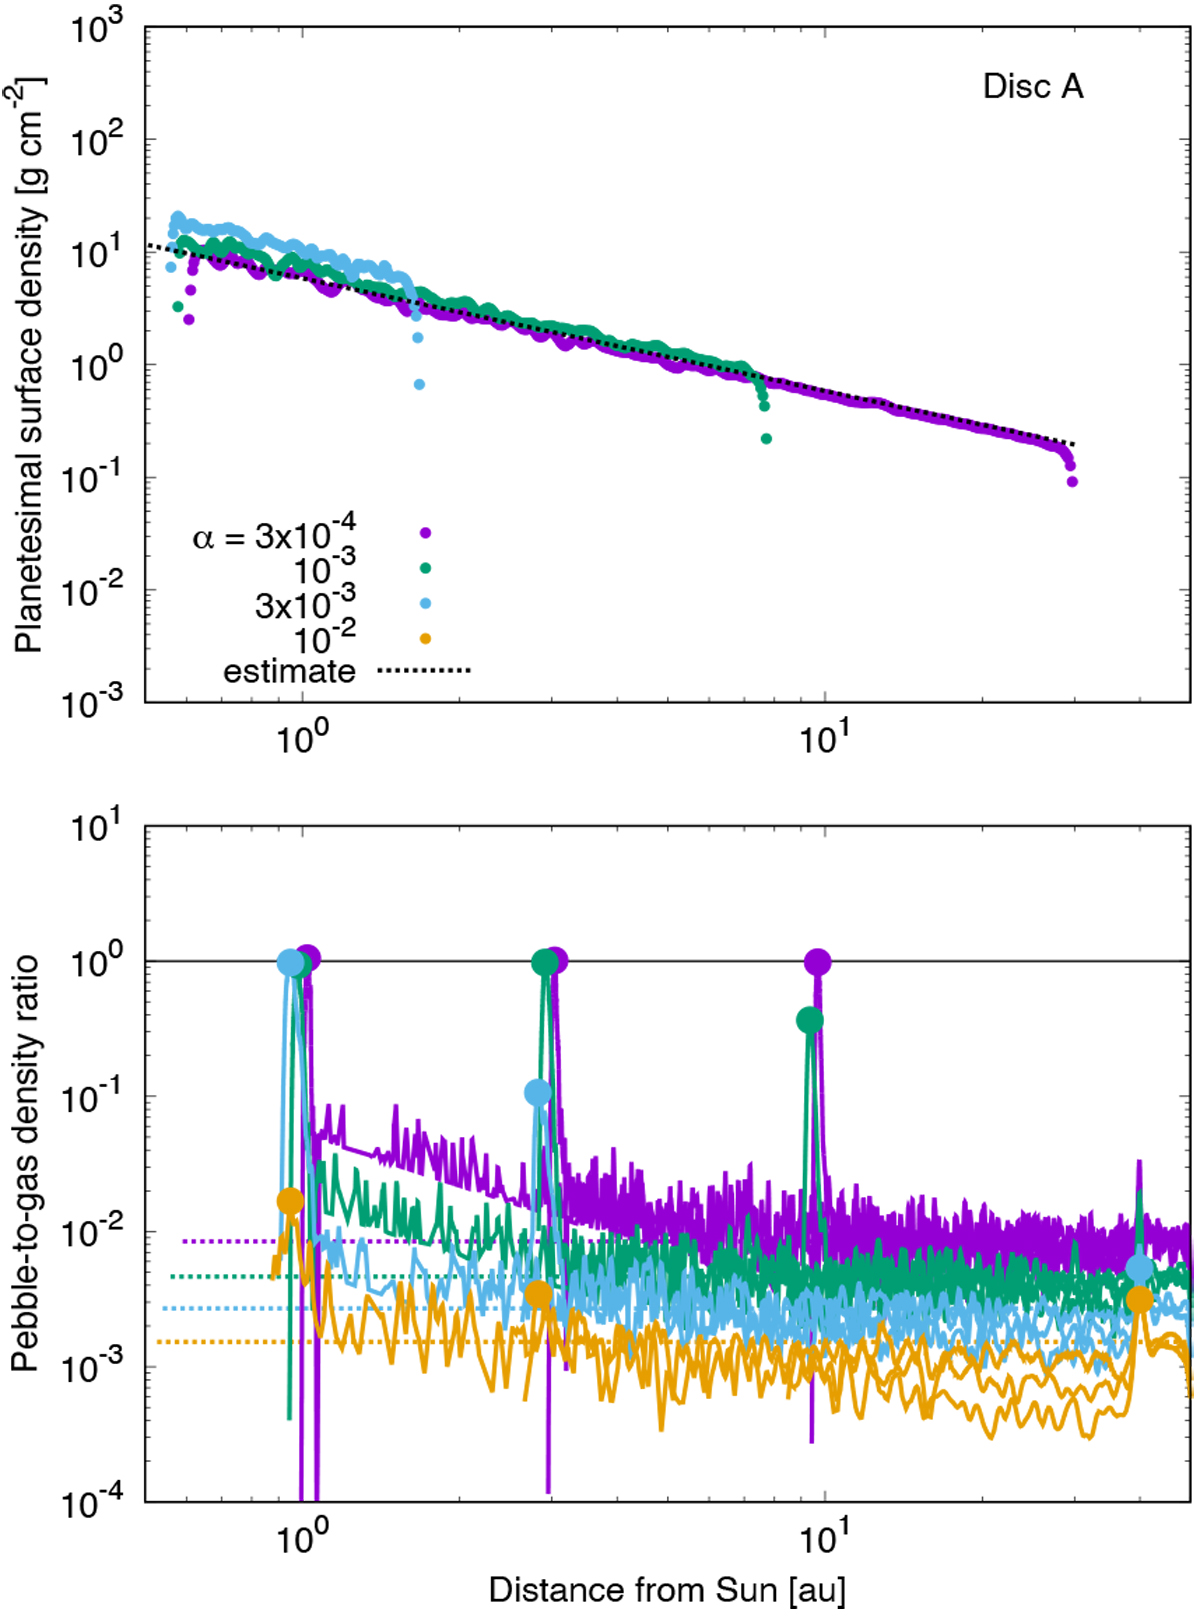
Profiles with different strengths of turbulence. Upper panel: planetesimal surface density with Disc A and Ṁpeb = 10−4 ME yr−1. Lower panel: snapshots of the pebble-to-gas density ratio on the mid-plane with the same condition at t = 3.0 × 10⁵, 3.8 × 10⁵, and 4.0 × 10⁵ yr. The purple, green, light blue, and orange plots represent the profiles with α = 3 × 10⁻⁴, 10−3, 3 × 10⁻³, and 10−2. The dotted line in the upper panel indicates the estimated planetesimal surface density by Eq. (21). No planetesimals form with α = 10−2. The dotted lines in the lower panel indicate the unperturbed pebble-to-gas density ratios on the mid-planes (Eq. (20)). The black line in the lower panel represents where the ratio is unity.
Current usage metrics show cumulative count of Article Views (full-text article views including HTML views, PDF and ePub downloads, according to the available data) and Abstracts Views on Vision4Press platform.
Data correspond to usage on the plateform after 2015. The current usage metrics is available 48-96 hours after online publication and is updated daily on week days.
Initial download of the metrics may take a while.